> ## Documentation Index
> Fetch the complete documentation index at: https://docs.pulsy.app/llms.txt
> Use this file to discover all available pages before exploring further.
# Create, Test, and Deploy a Feed
> Build a feed, test it against a block, and deploy it.
# Create, Test, and Deploy a Feed
A feed listens to the blockchain data you define, decides what matters, and emits a structured payload when the feed logic matches. In the dashboard, you can create a feed with the AI assistant or configure each part manually.
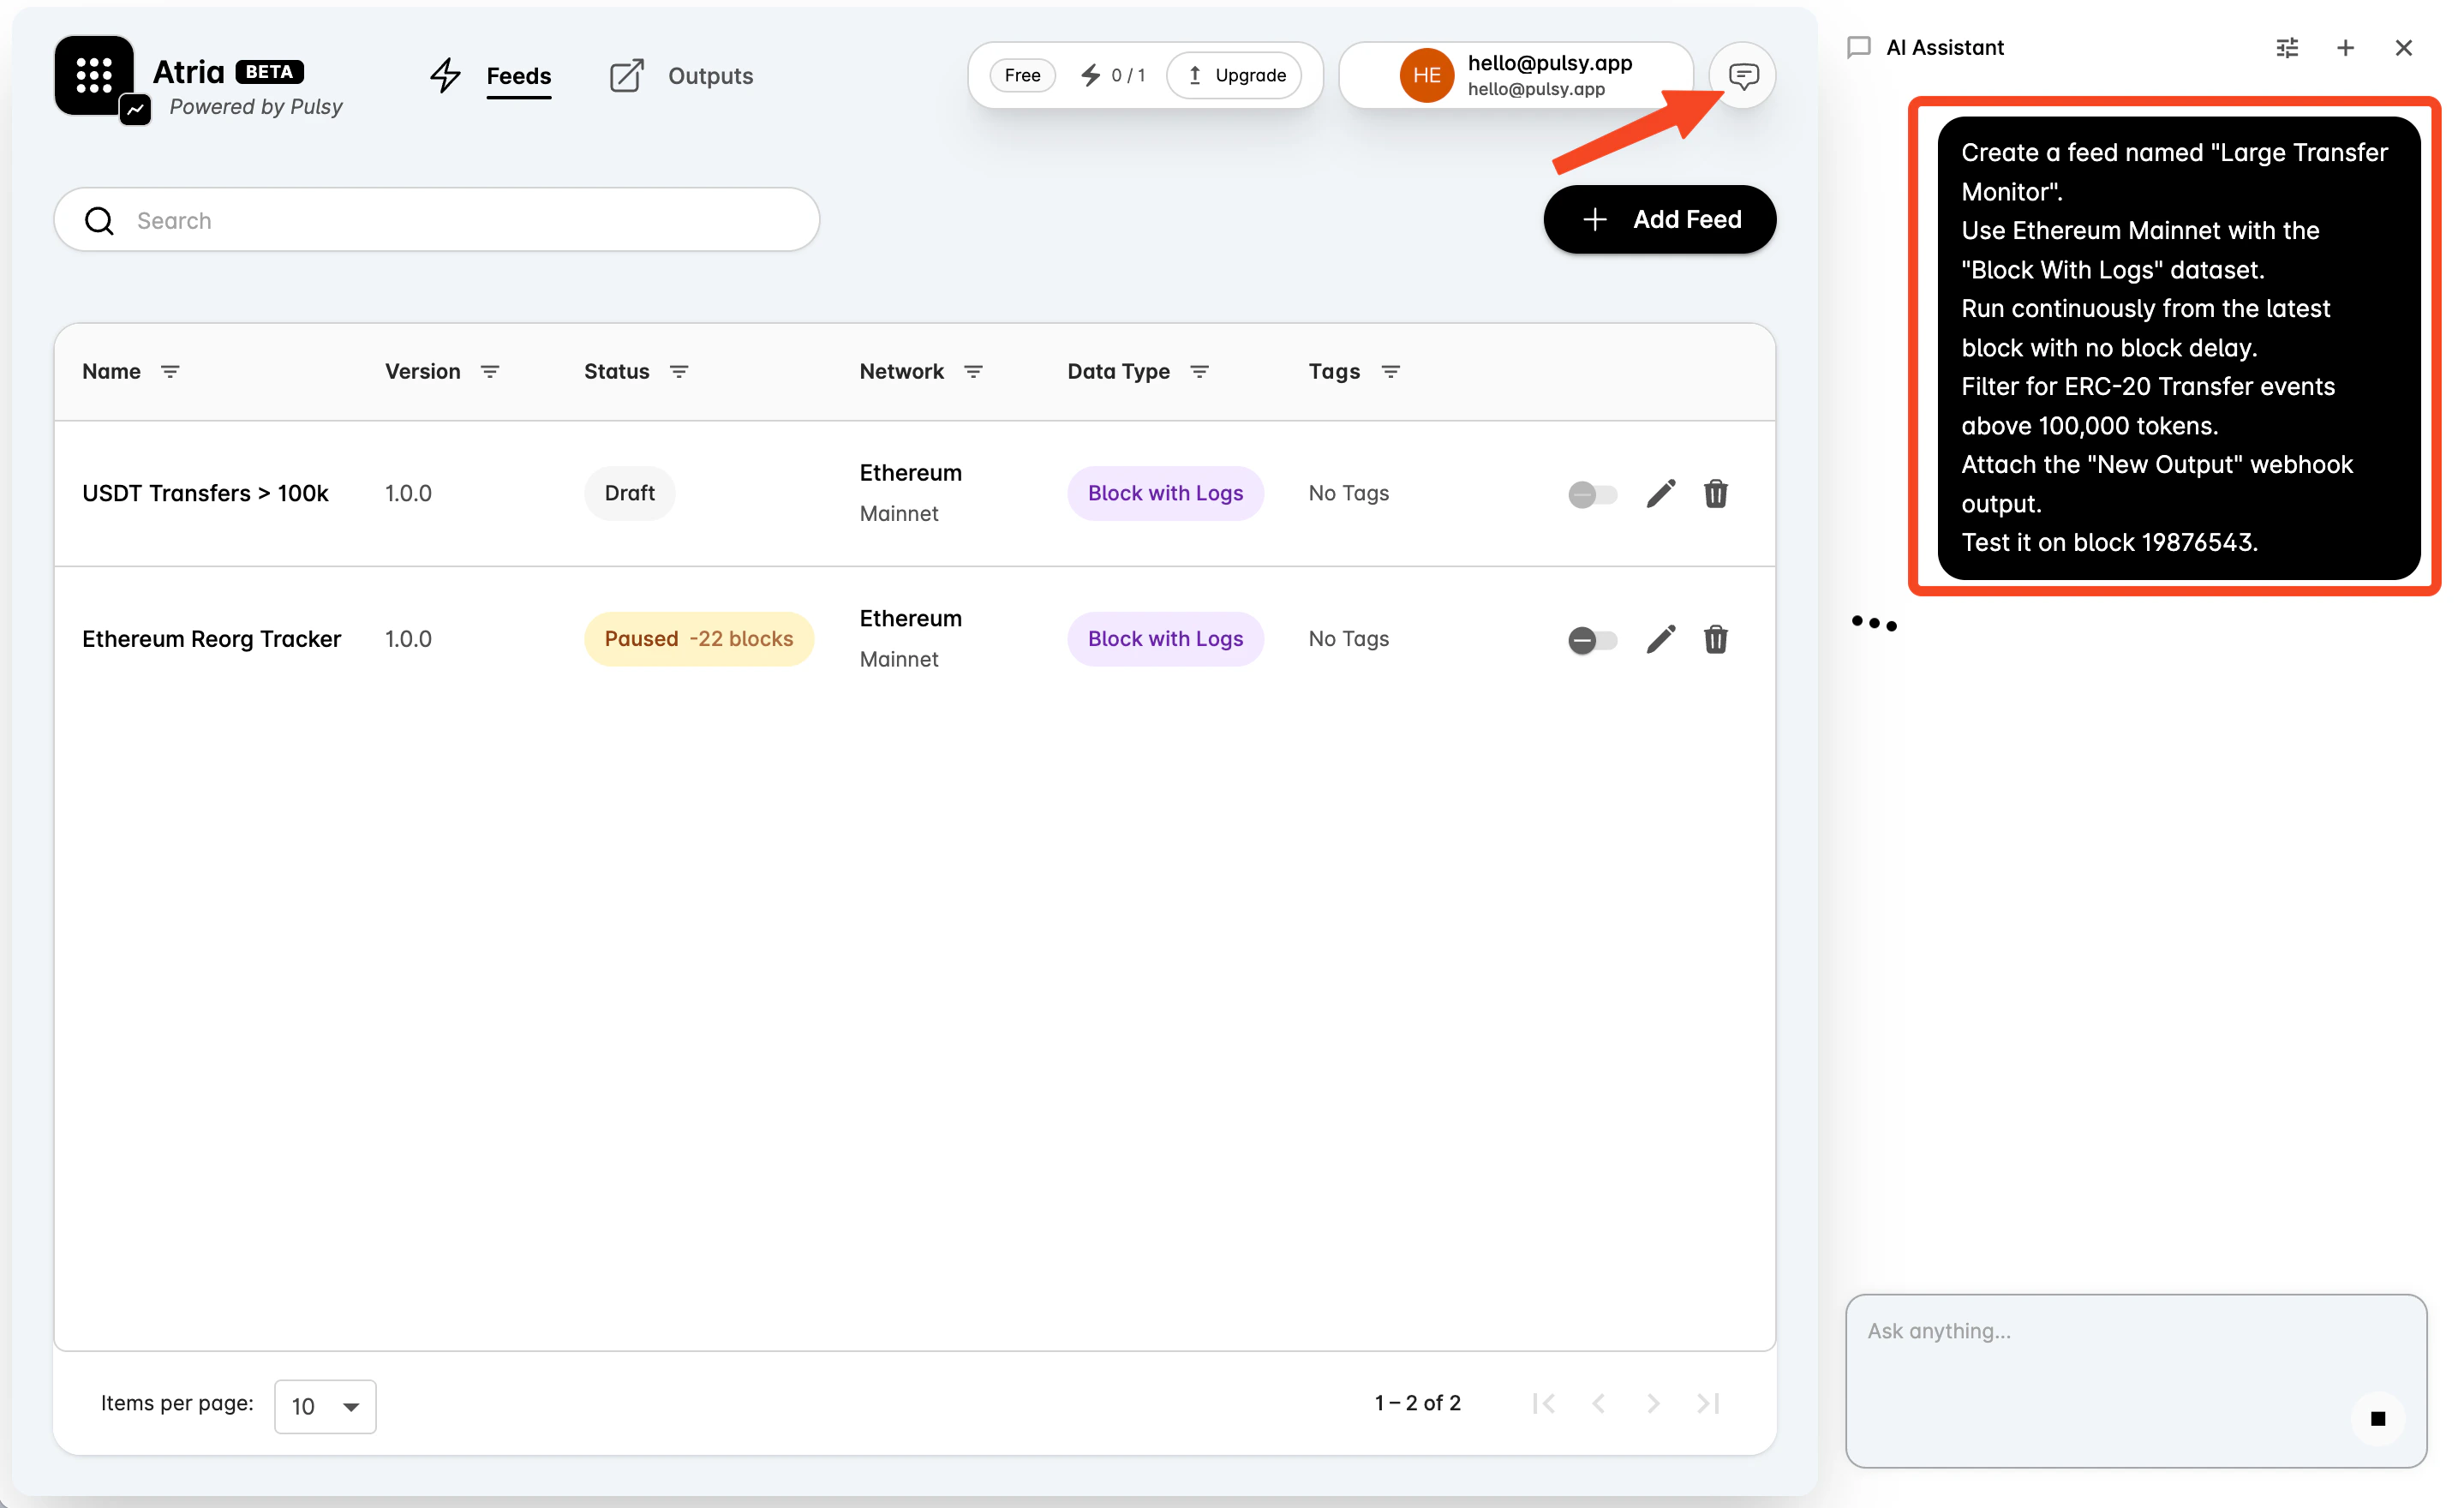
## Use the AI Assistant
Give the AI assistant the feed name, source, stream behavior, filter logic, outputs, and test block, and it will create the feed.
Example prompt:
```text theme={null}
Create a feed named "Large Transfer Monitor".
Use Ethereum Mainnet with the "Block With Logs" dataset.
Run continuously from the latest block with no block delay.
Filter for ERC-20 Transfer events above 100,000 tokens.
Attach the "New Output" webhook output.
Test it on block 19876543.
```
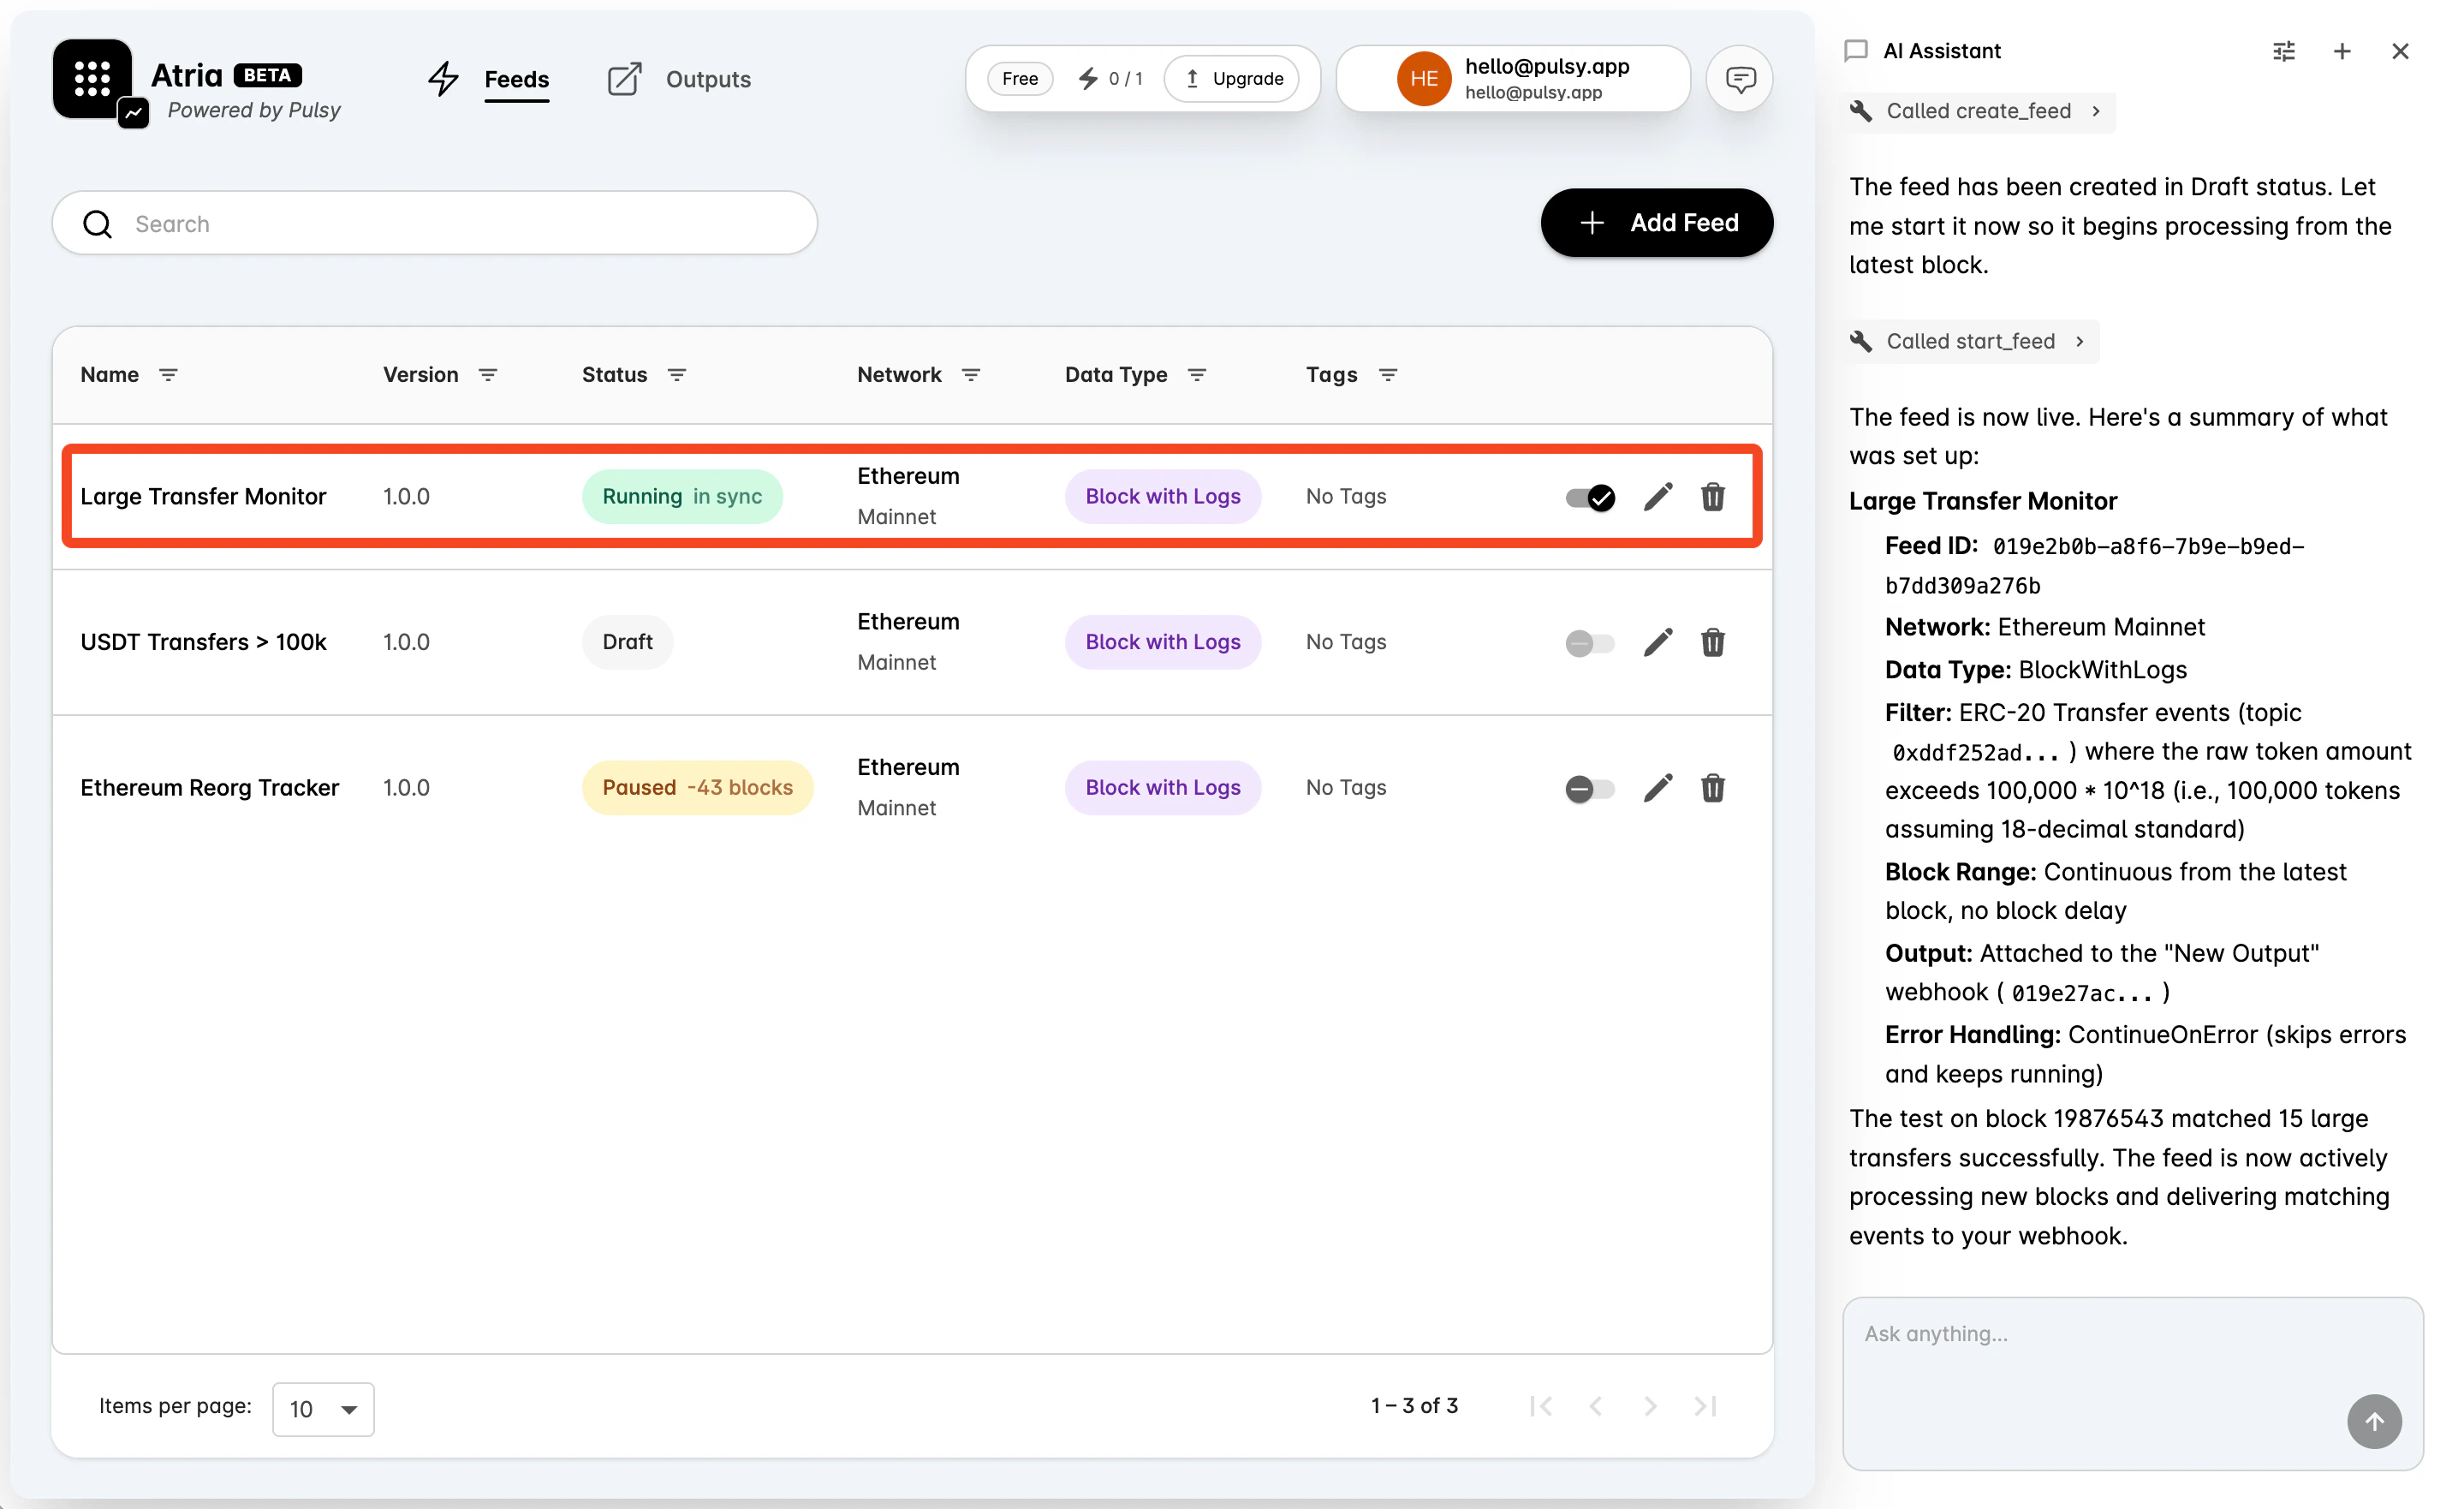
 After the AI assistant creates the feed, review the settings, filter, output, and test result before connecting it to your systems.
 ## Create a Feed Manually
Use the manual flow when you want to configure each part yourself.
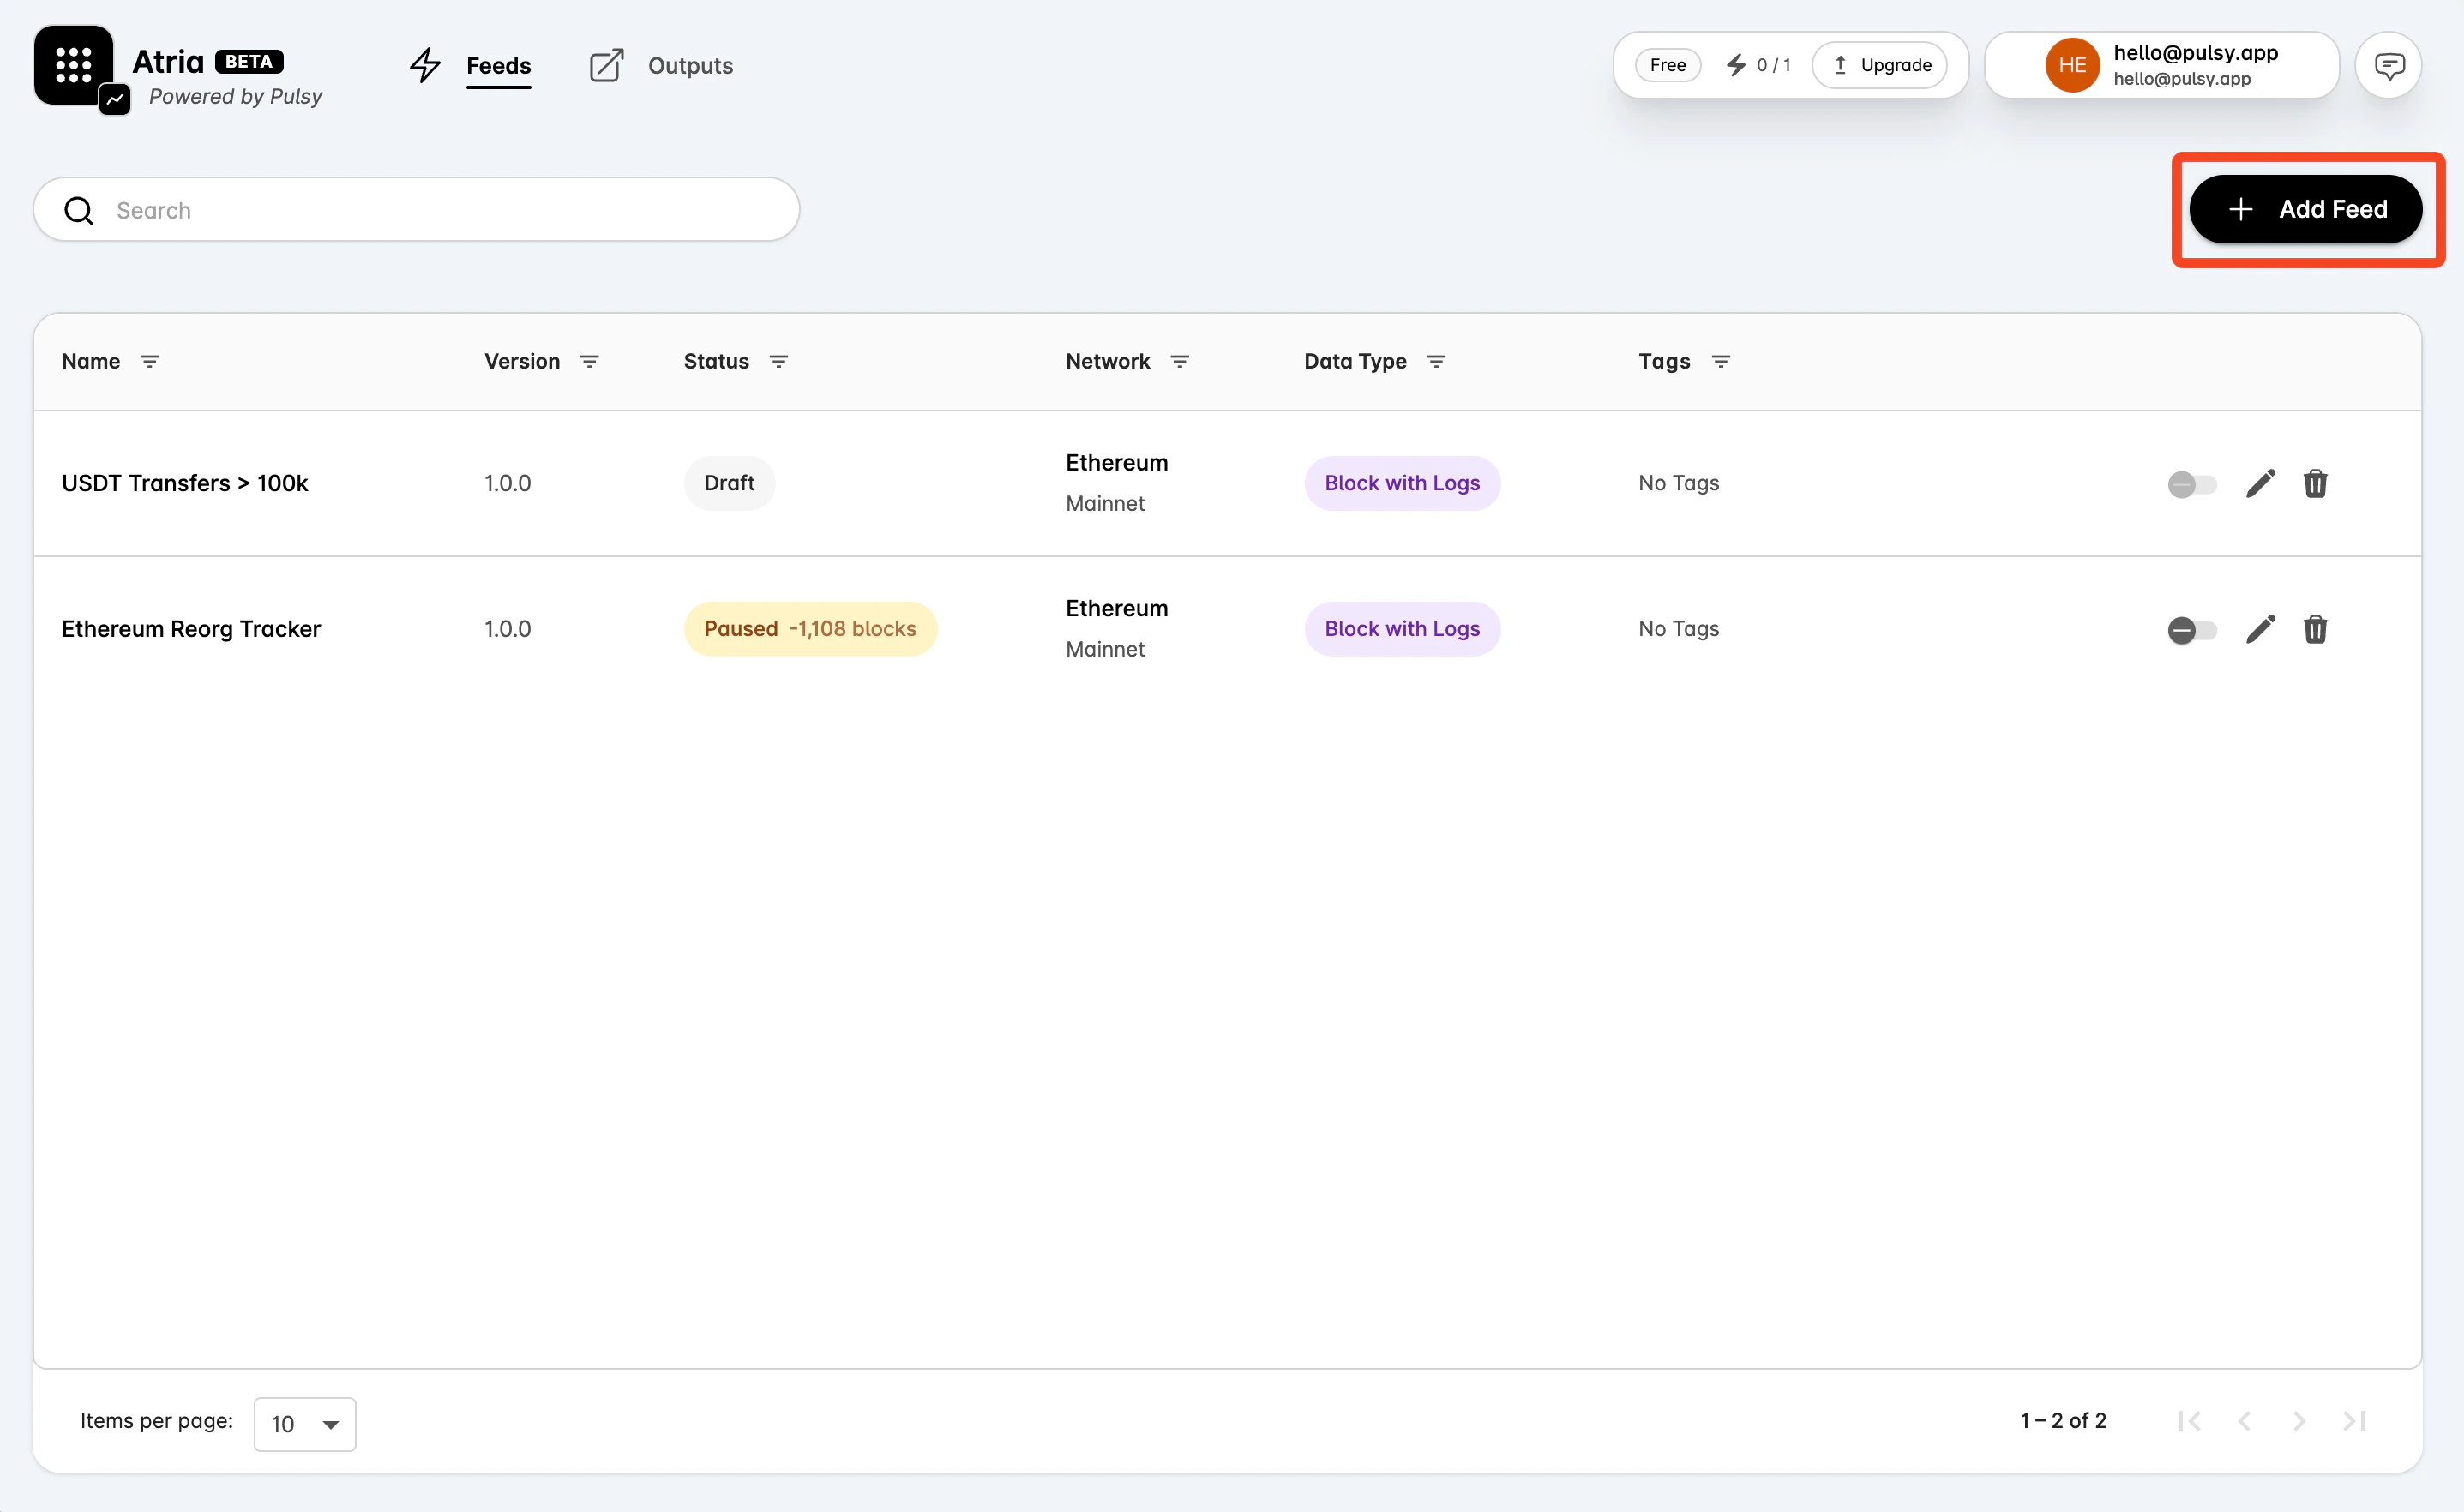
### Create a Feed
1. Go to **Feeds**.
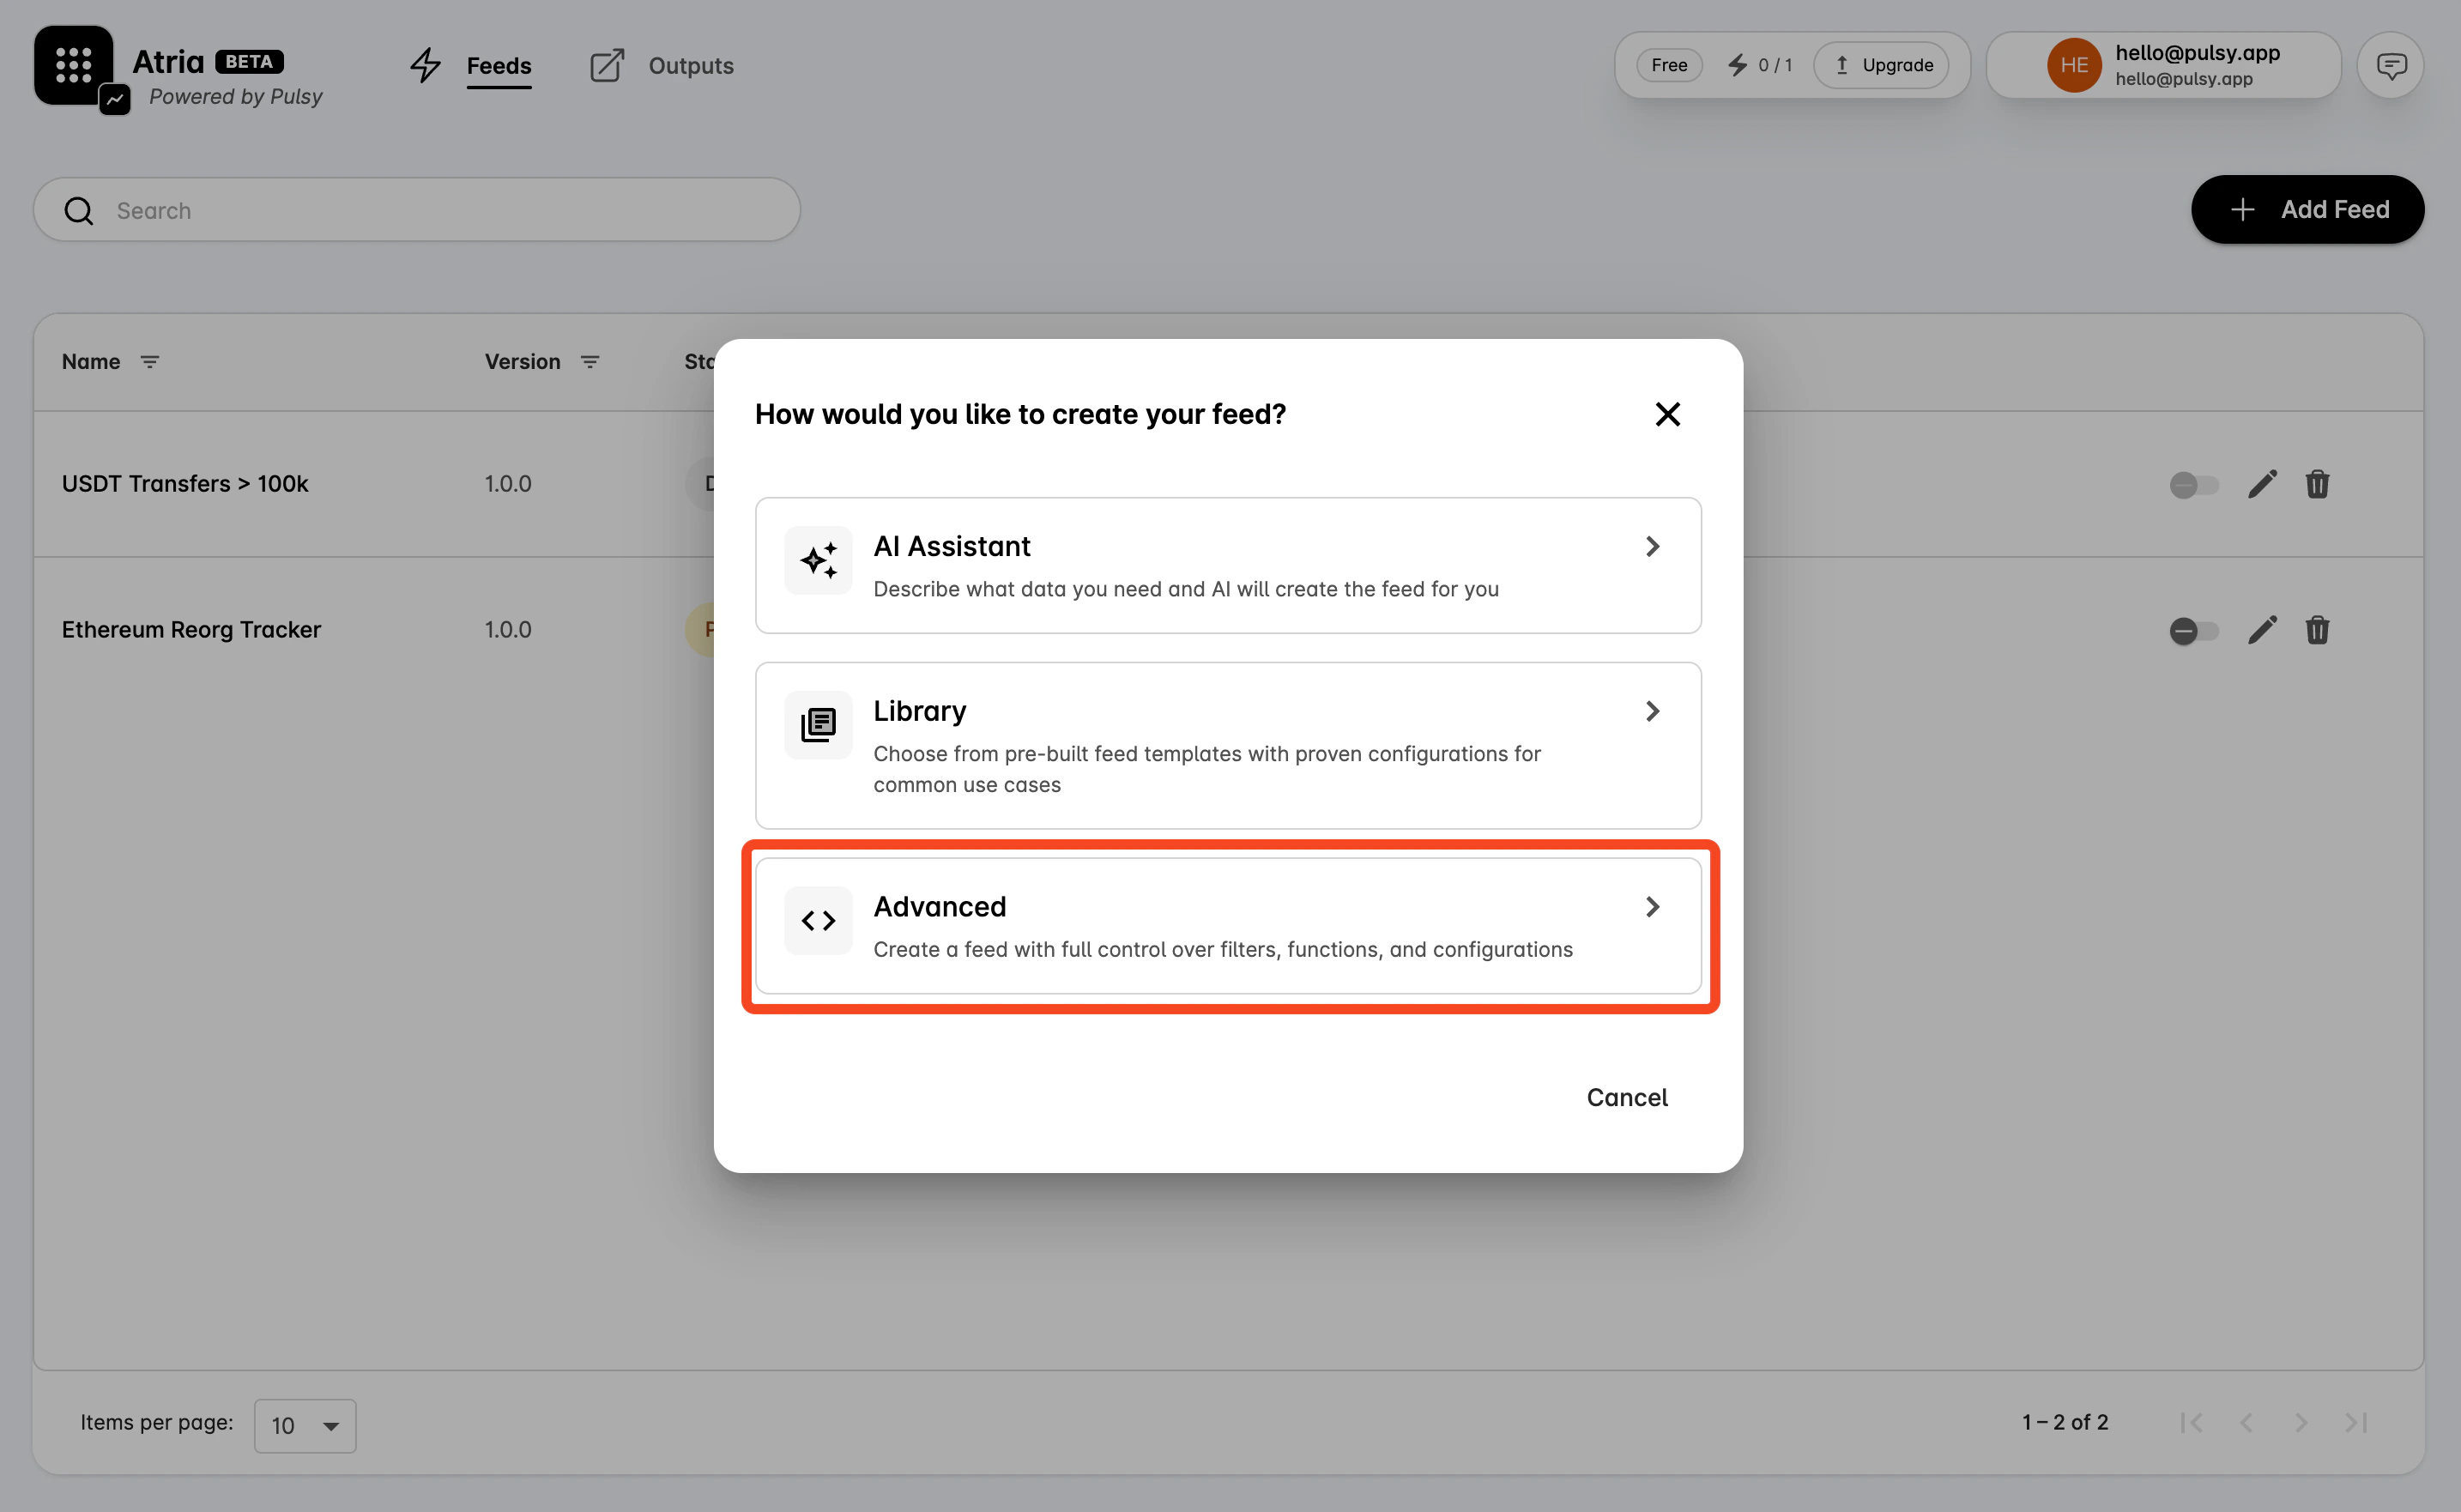
2. Select **Add Feed**.
## Create a Feed Manually
Use the manual flow when you want to configure each part yourself.
### Create a Feed
1. Go to **Feeds**.
2. Select **Add Feed**.
 The dashboard opens a mode selection screen. Select **Advanced Mode** to create the feed manually.
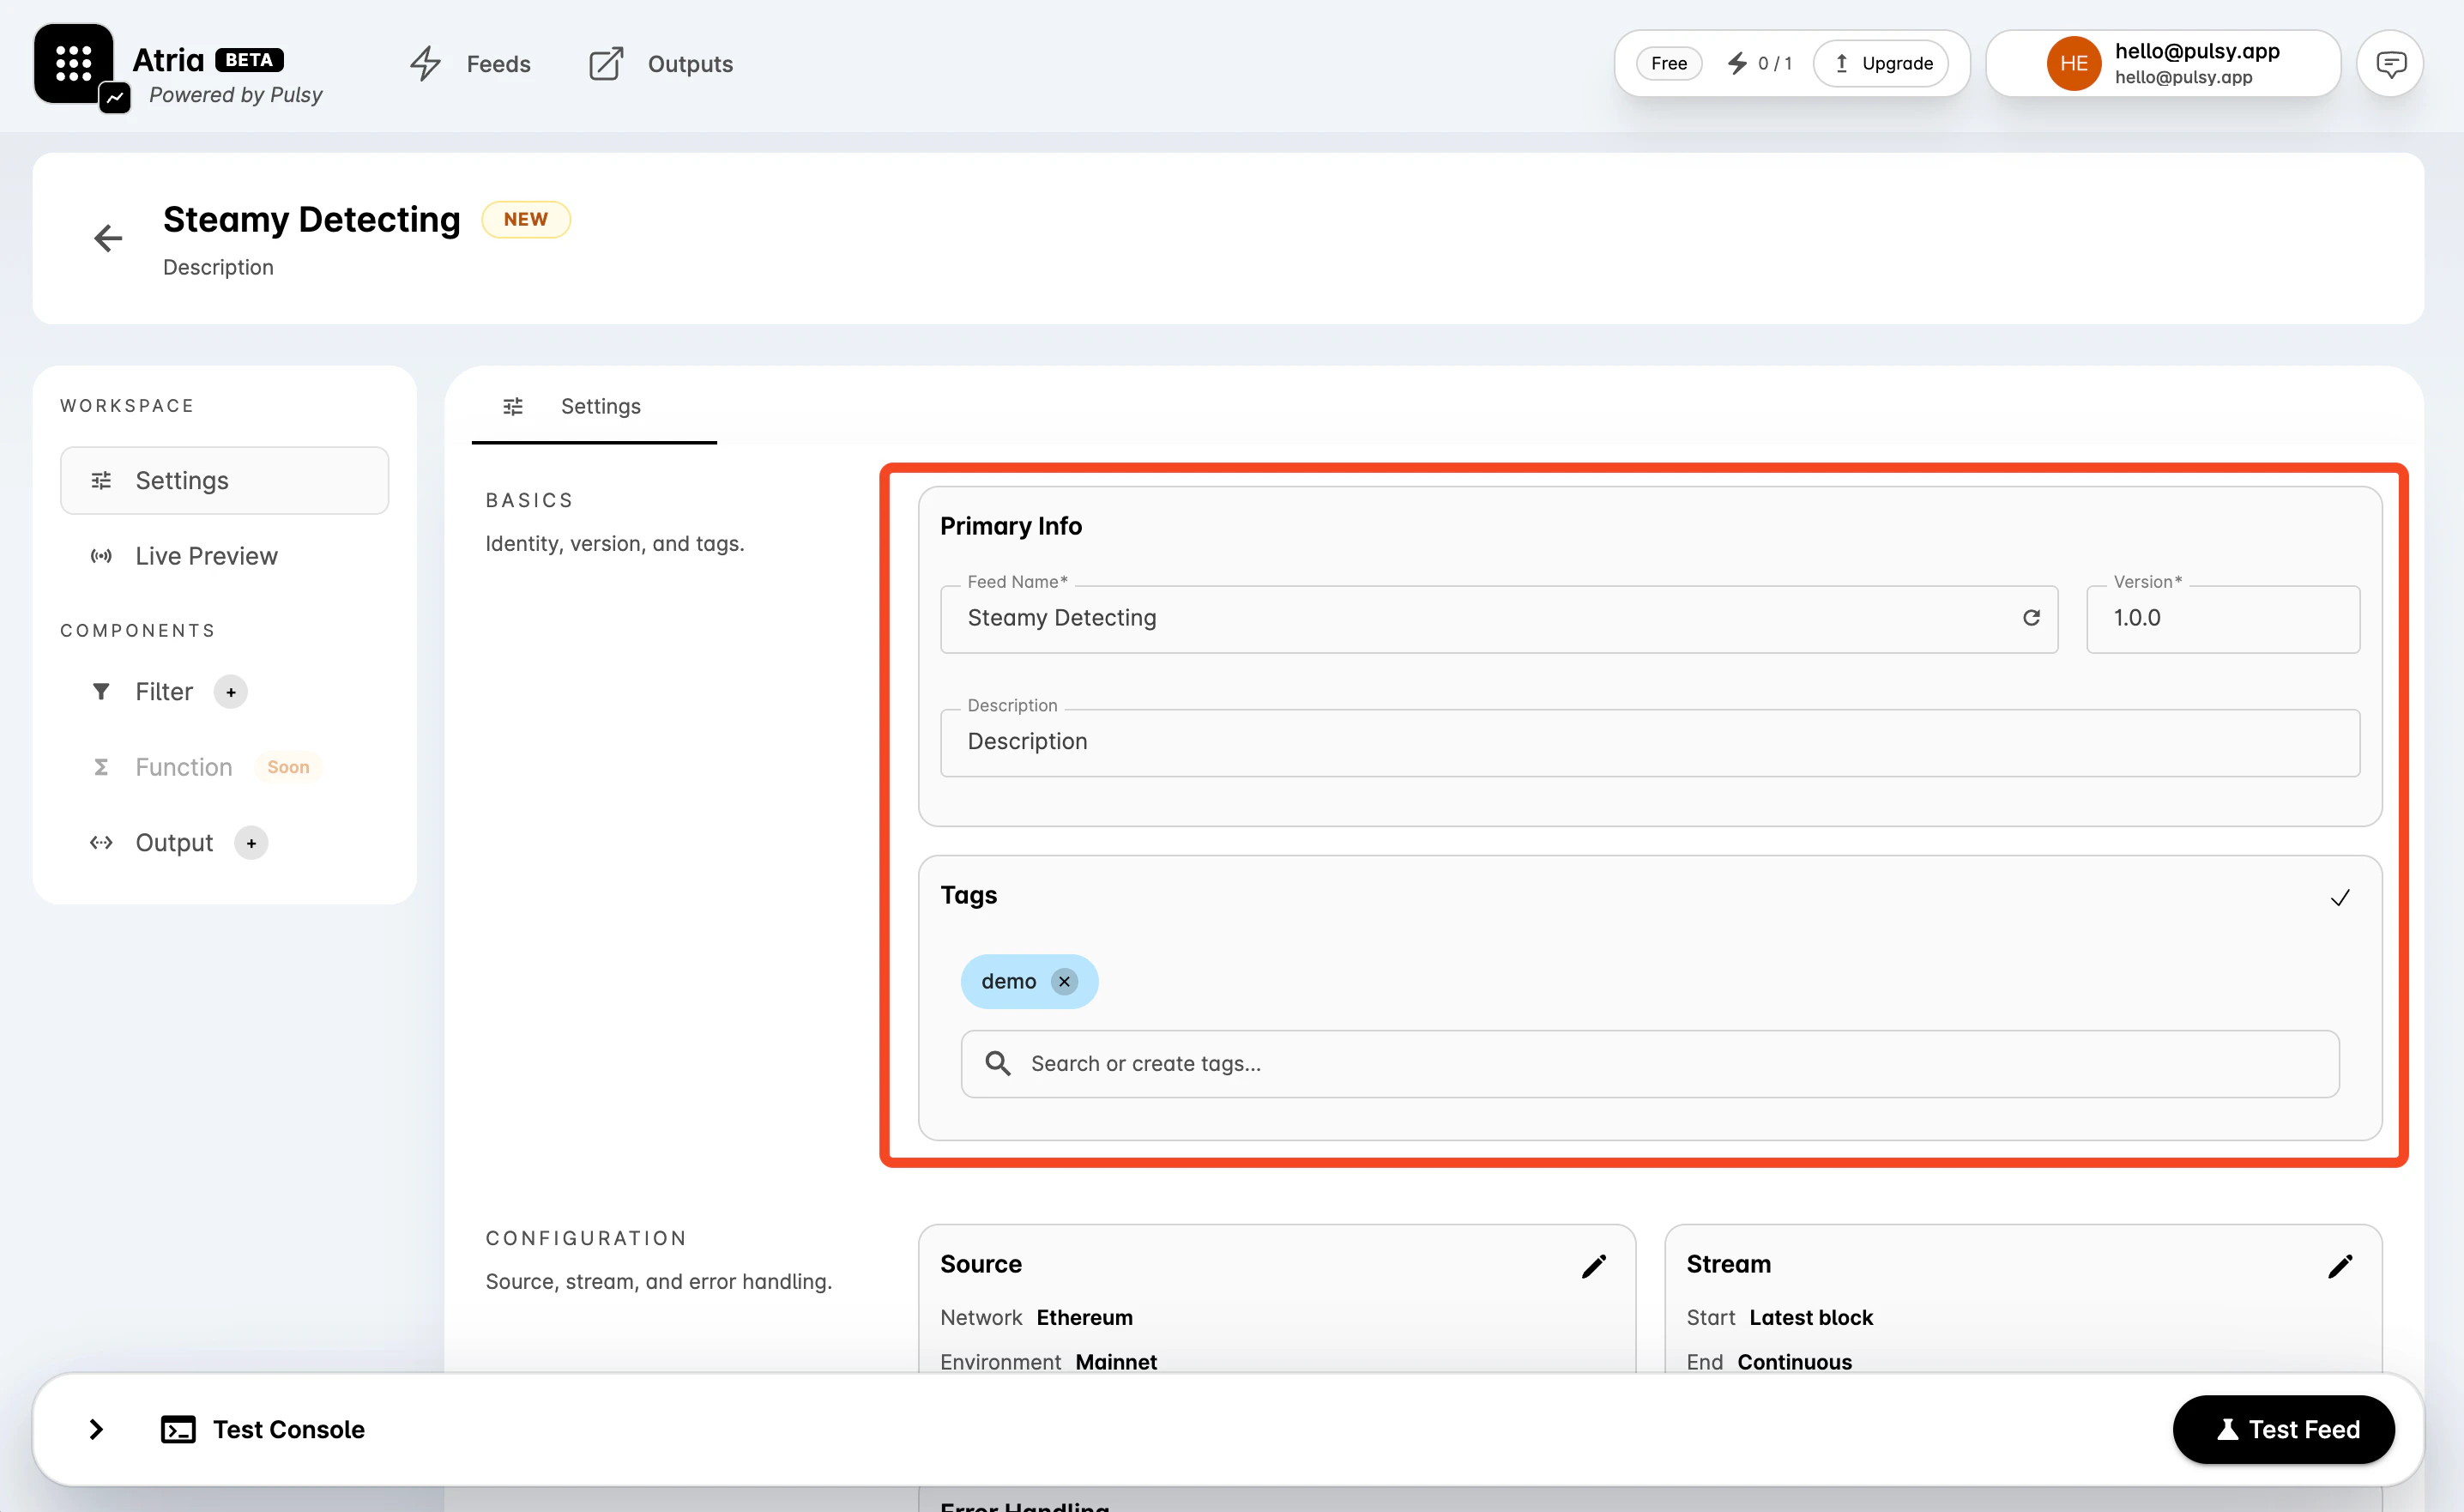
 After you select **Advanced Mode**, the dashboard opens a new feed workspace with the **Settings** tab selected.
### Configure Settings
In **Settings**, review the **Basics** section:
1. Keep the generated **Feed Name** or enter your own.
2. Set **Version** using semantic versioning, such as `1.0.0`.
3. Add an optional **Description**.
4. Add tags to organize the feed in the way your team works, for example by use case, chain, protocol, or owner.
After you select **Advanced Mode**, the dashboard opens a new feed workspace with the **Settings** tab selected.
### Configure Settings
In **Settings**, review the **Basics** section:
1. Keep the generated **Feed Name** or enter your own.
2. Set **Version** using semantic versioning, such as `1.0.0`.
3. Add an optional **Description**.
4. Add tags to organize the feed in the way your team works, for example by use case, chain, protocol, or owner.
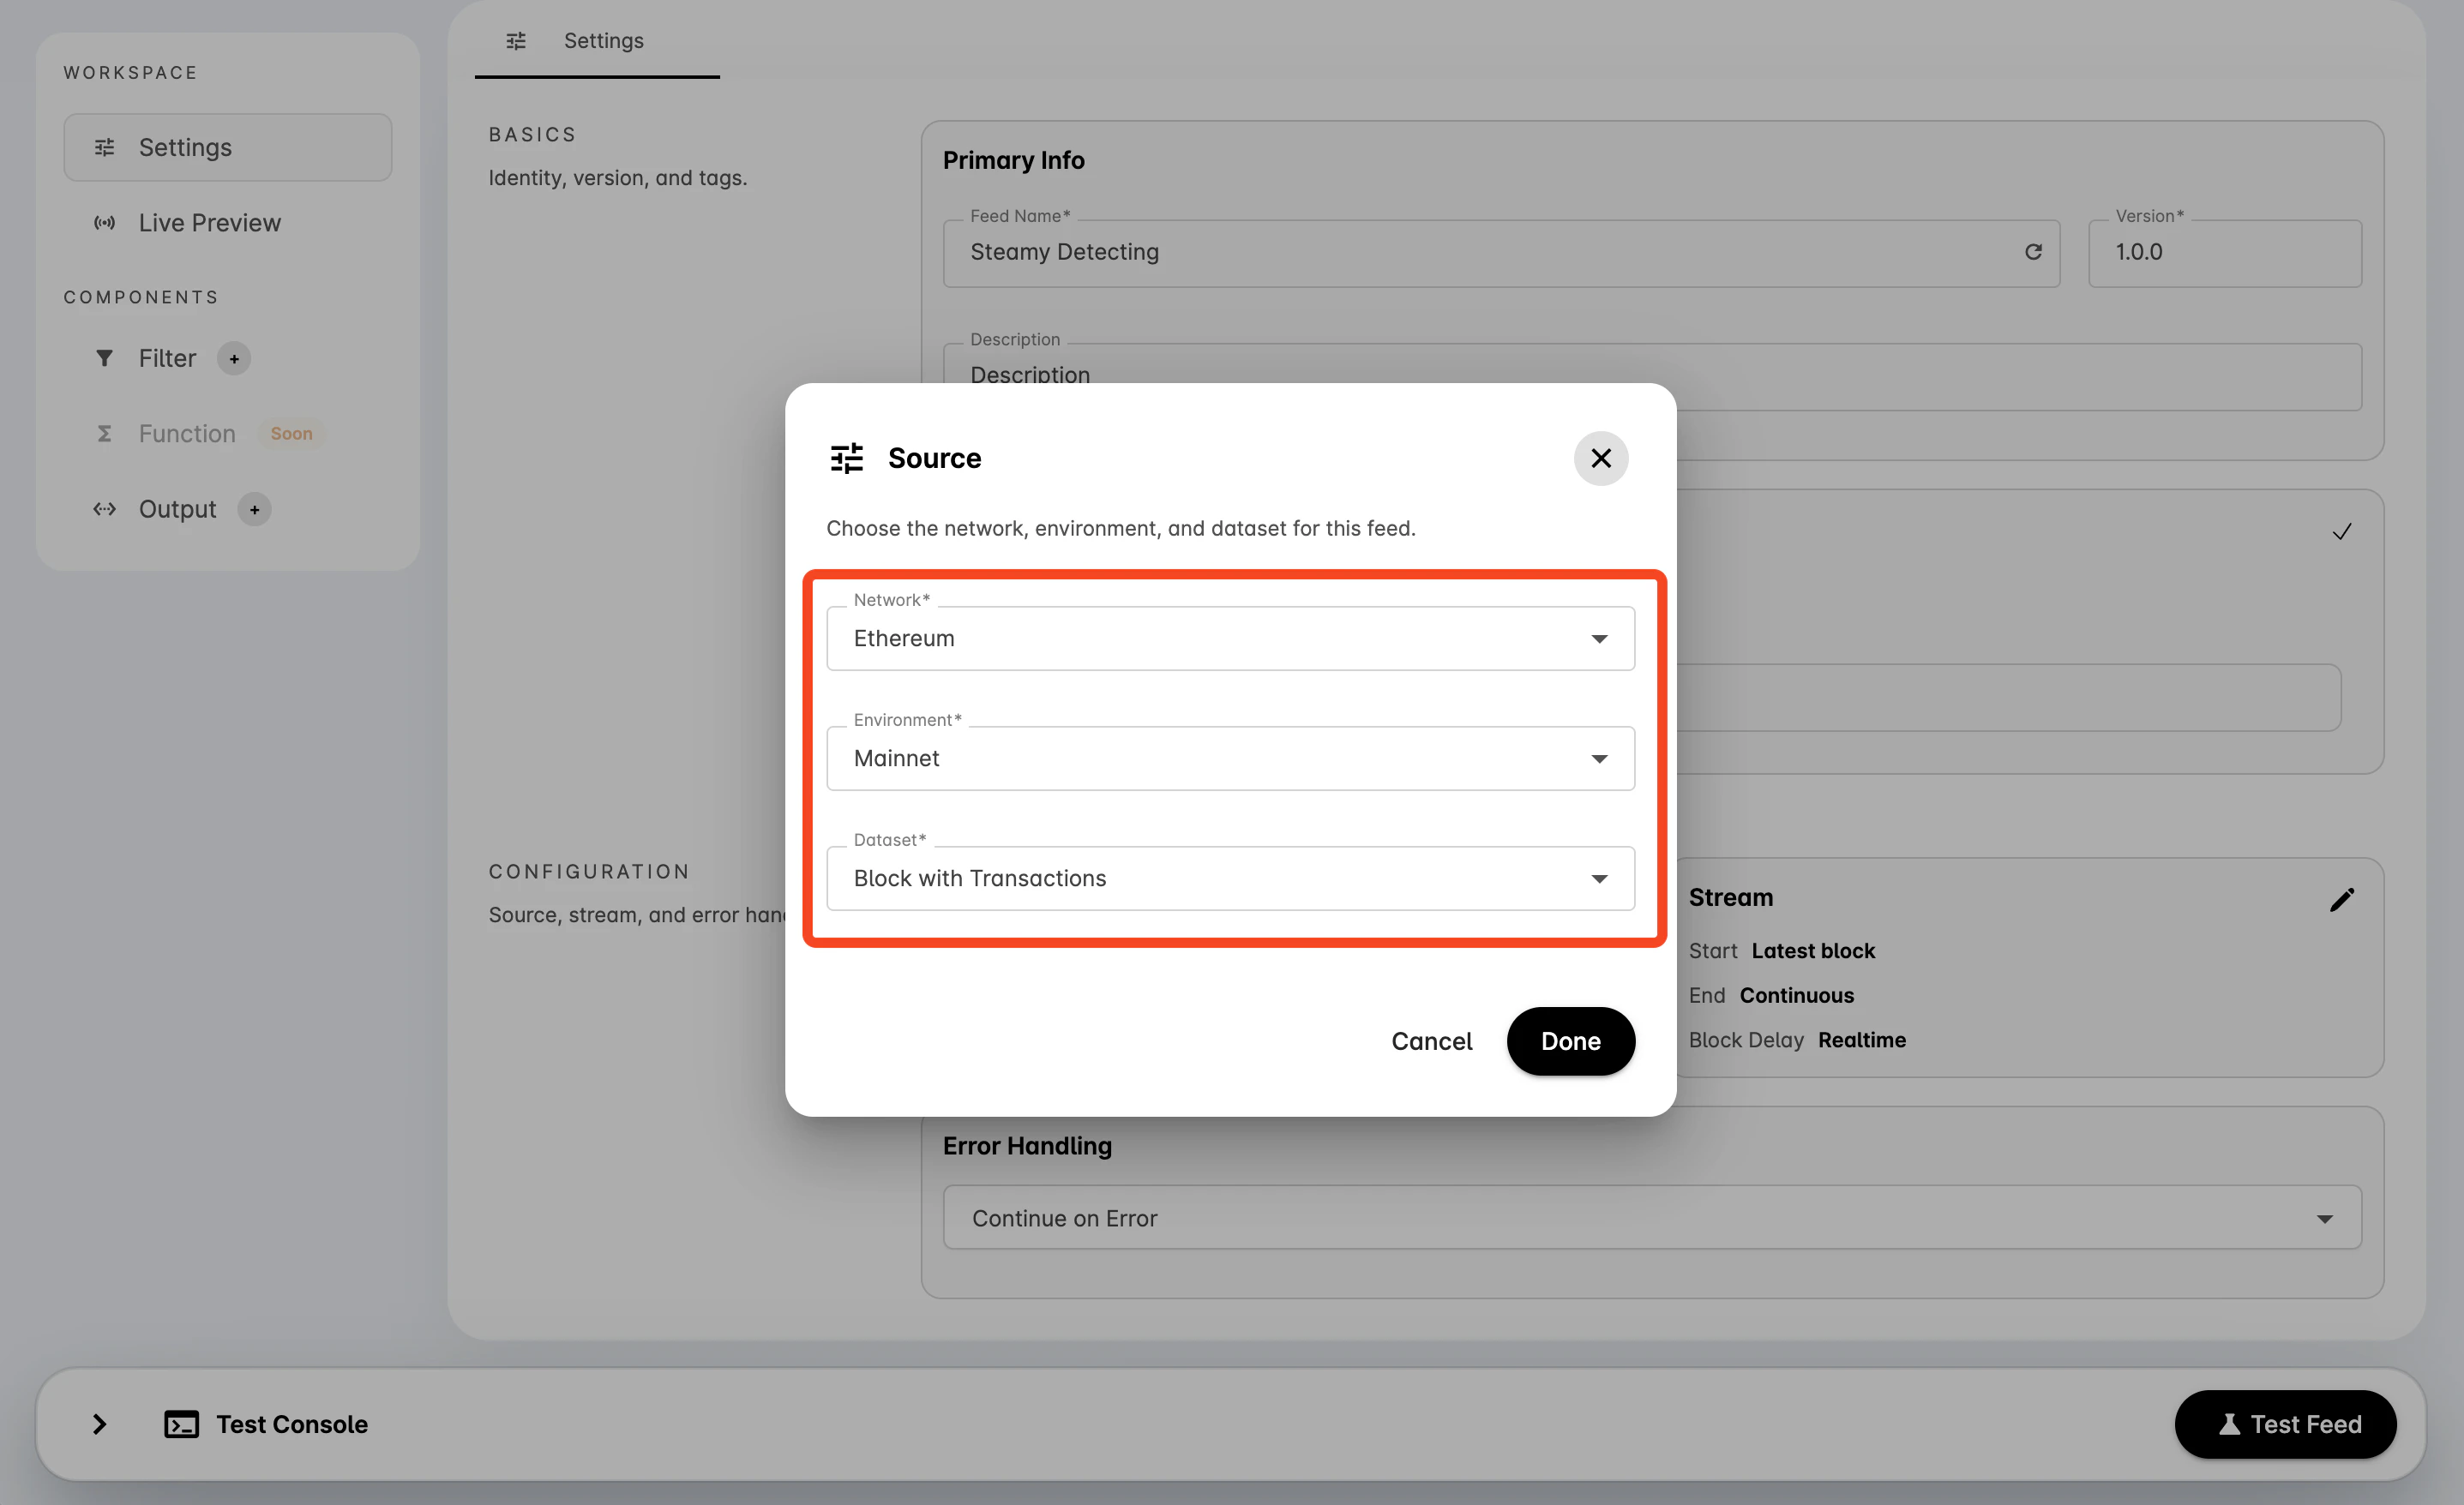
 ### Choose the Source
In **Configuration**, select the pencil icon on **Source**.
1. Choose a **Network**.
2. Choose an **Environment**.
3. Choose a **Dataset**.
4. Select **Done**.
### Choose the Source
In **Configuration**, select the pencil icon on **Source**.
1. Choose a **Network**.
2. Choose an **Environment**.
3. Choose a **Dataset**.
4. Select **Done**.
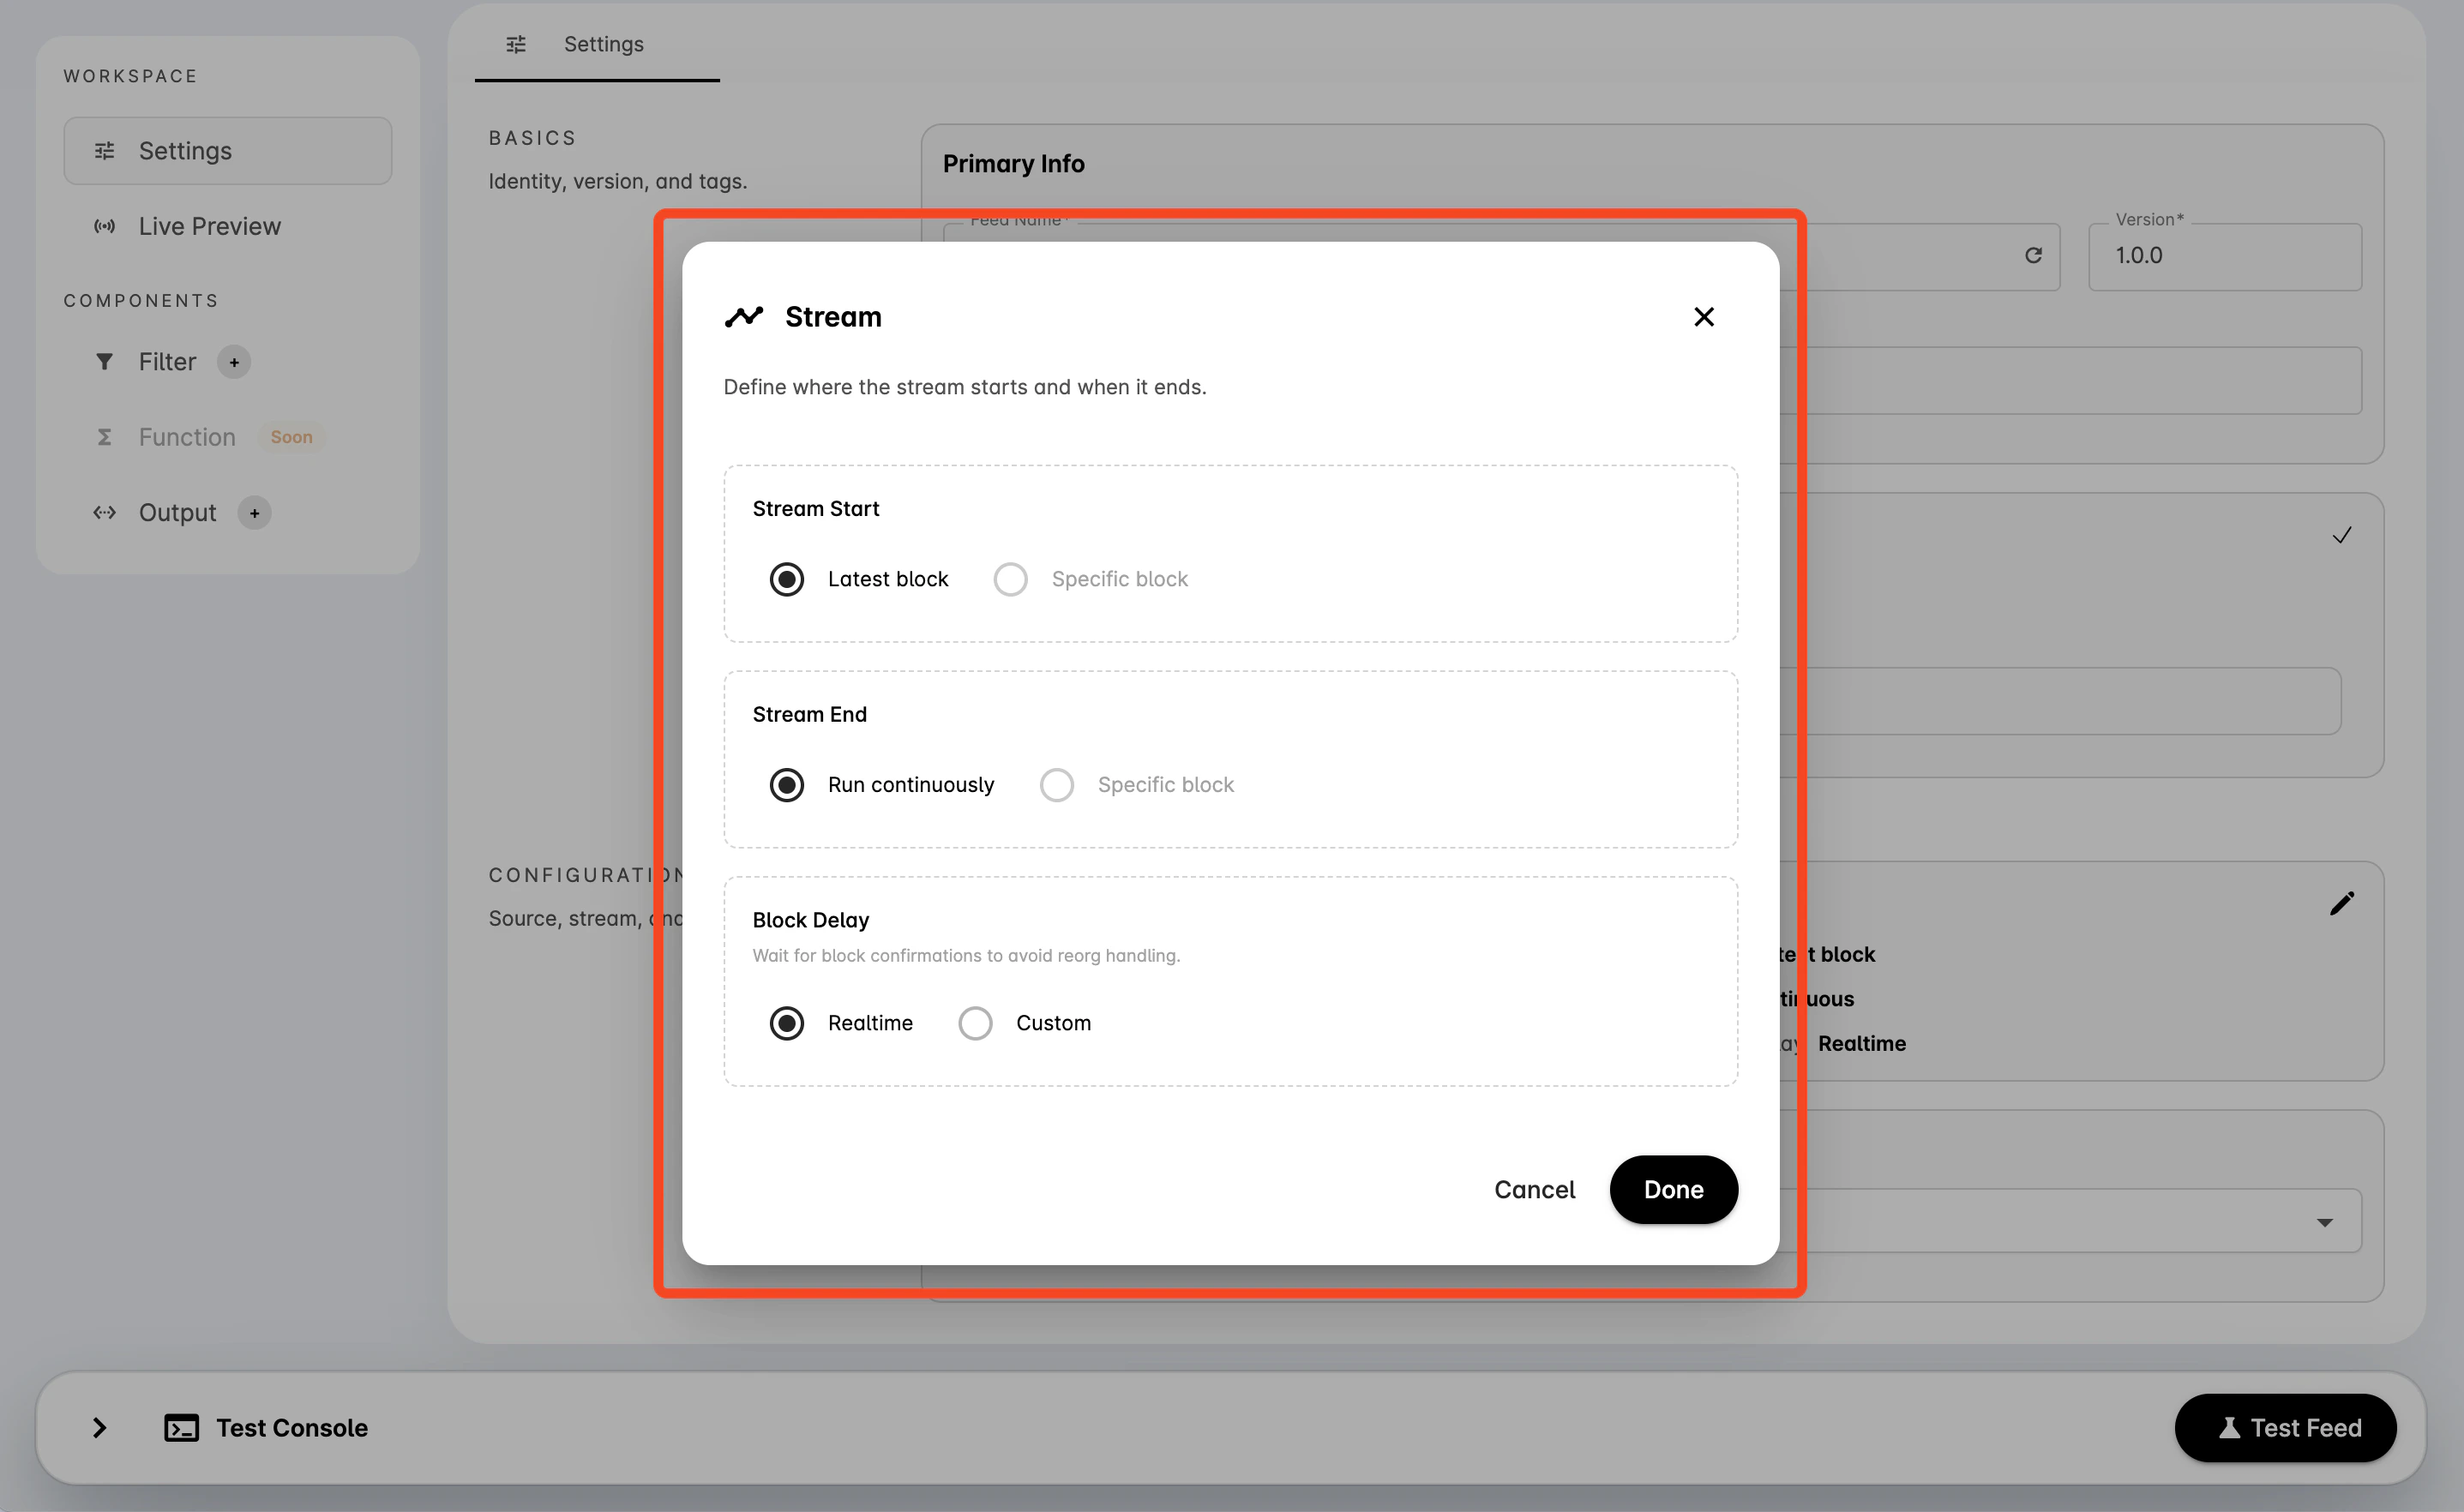
 ### Configure the Stream
Select the pencil icon on **Stream**.
1. Choose whether the feed should start from the **Latest block** or a **Specific block**.
2. Choose whether the feed should **Run continuously** or stop at a **Specific block**.
3. Choose **Realtime** for no block delay, or **Custom** to wait for a number of confirmations.
4. Select **Done**.
Use custom block ranges when you want the feed to process a defined section of chain history instead of running only from the latest block onward.
### Configure the Stream
Select the pencil icon on **Stream**.
1. Choose whether the feed should start from the **Latest block** or a **Specific block**.
2. Choose whether the feed should **Run continuously** or stop at a **Specific block**.
3. Choose **Realtime** for no block delay, or **Custom** to wait for a number of confirmations.
4. Select **Done**.
Use custom block ranges when you want the feed to process a defined section of chain history instead of running only from the latest block onward.
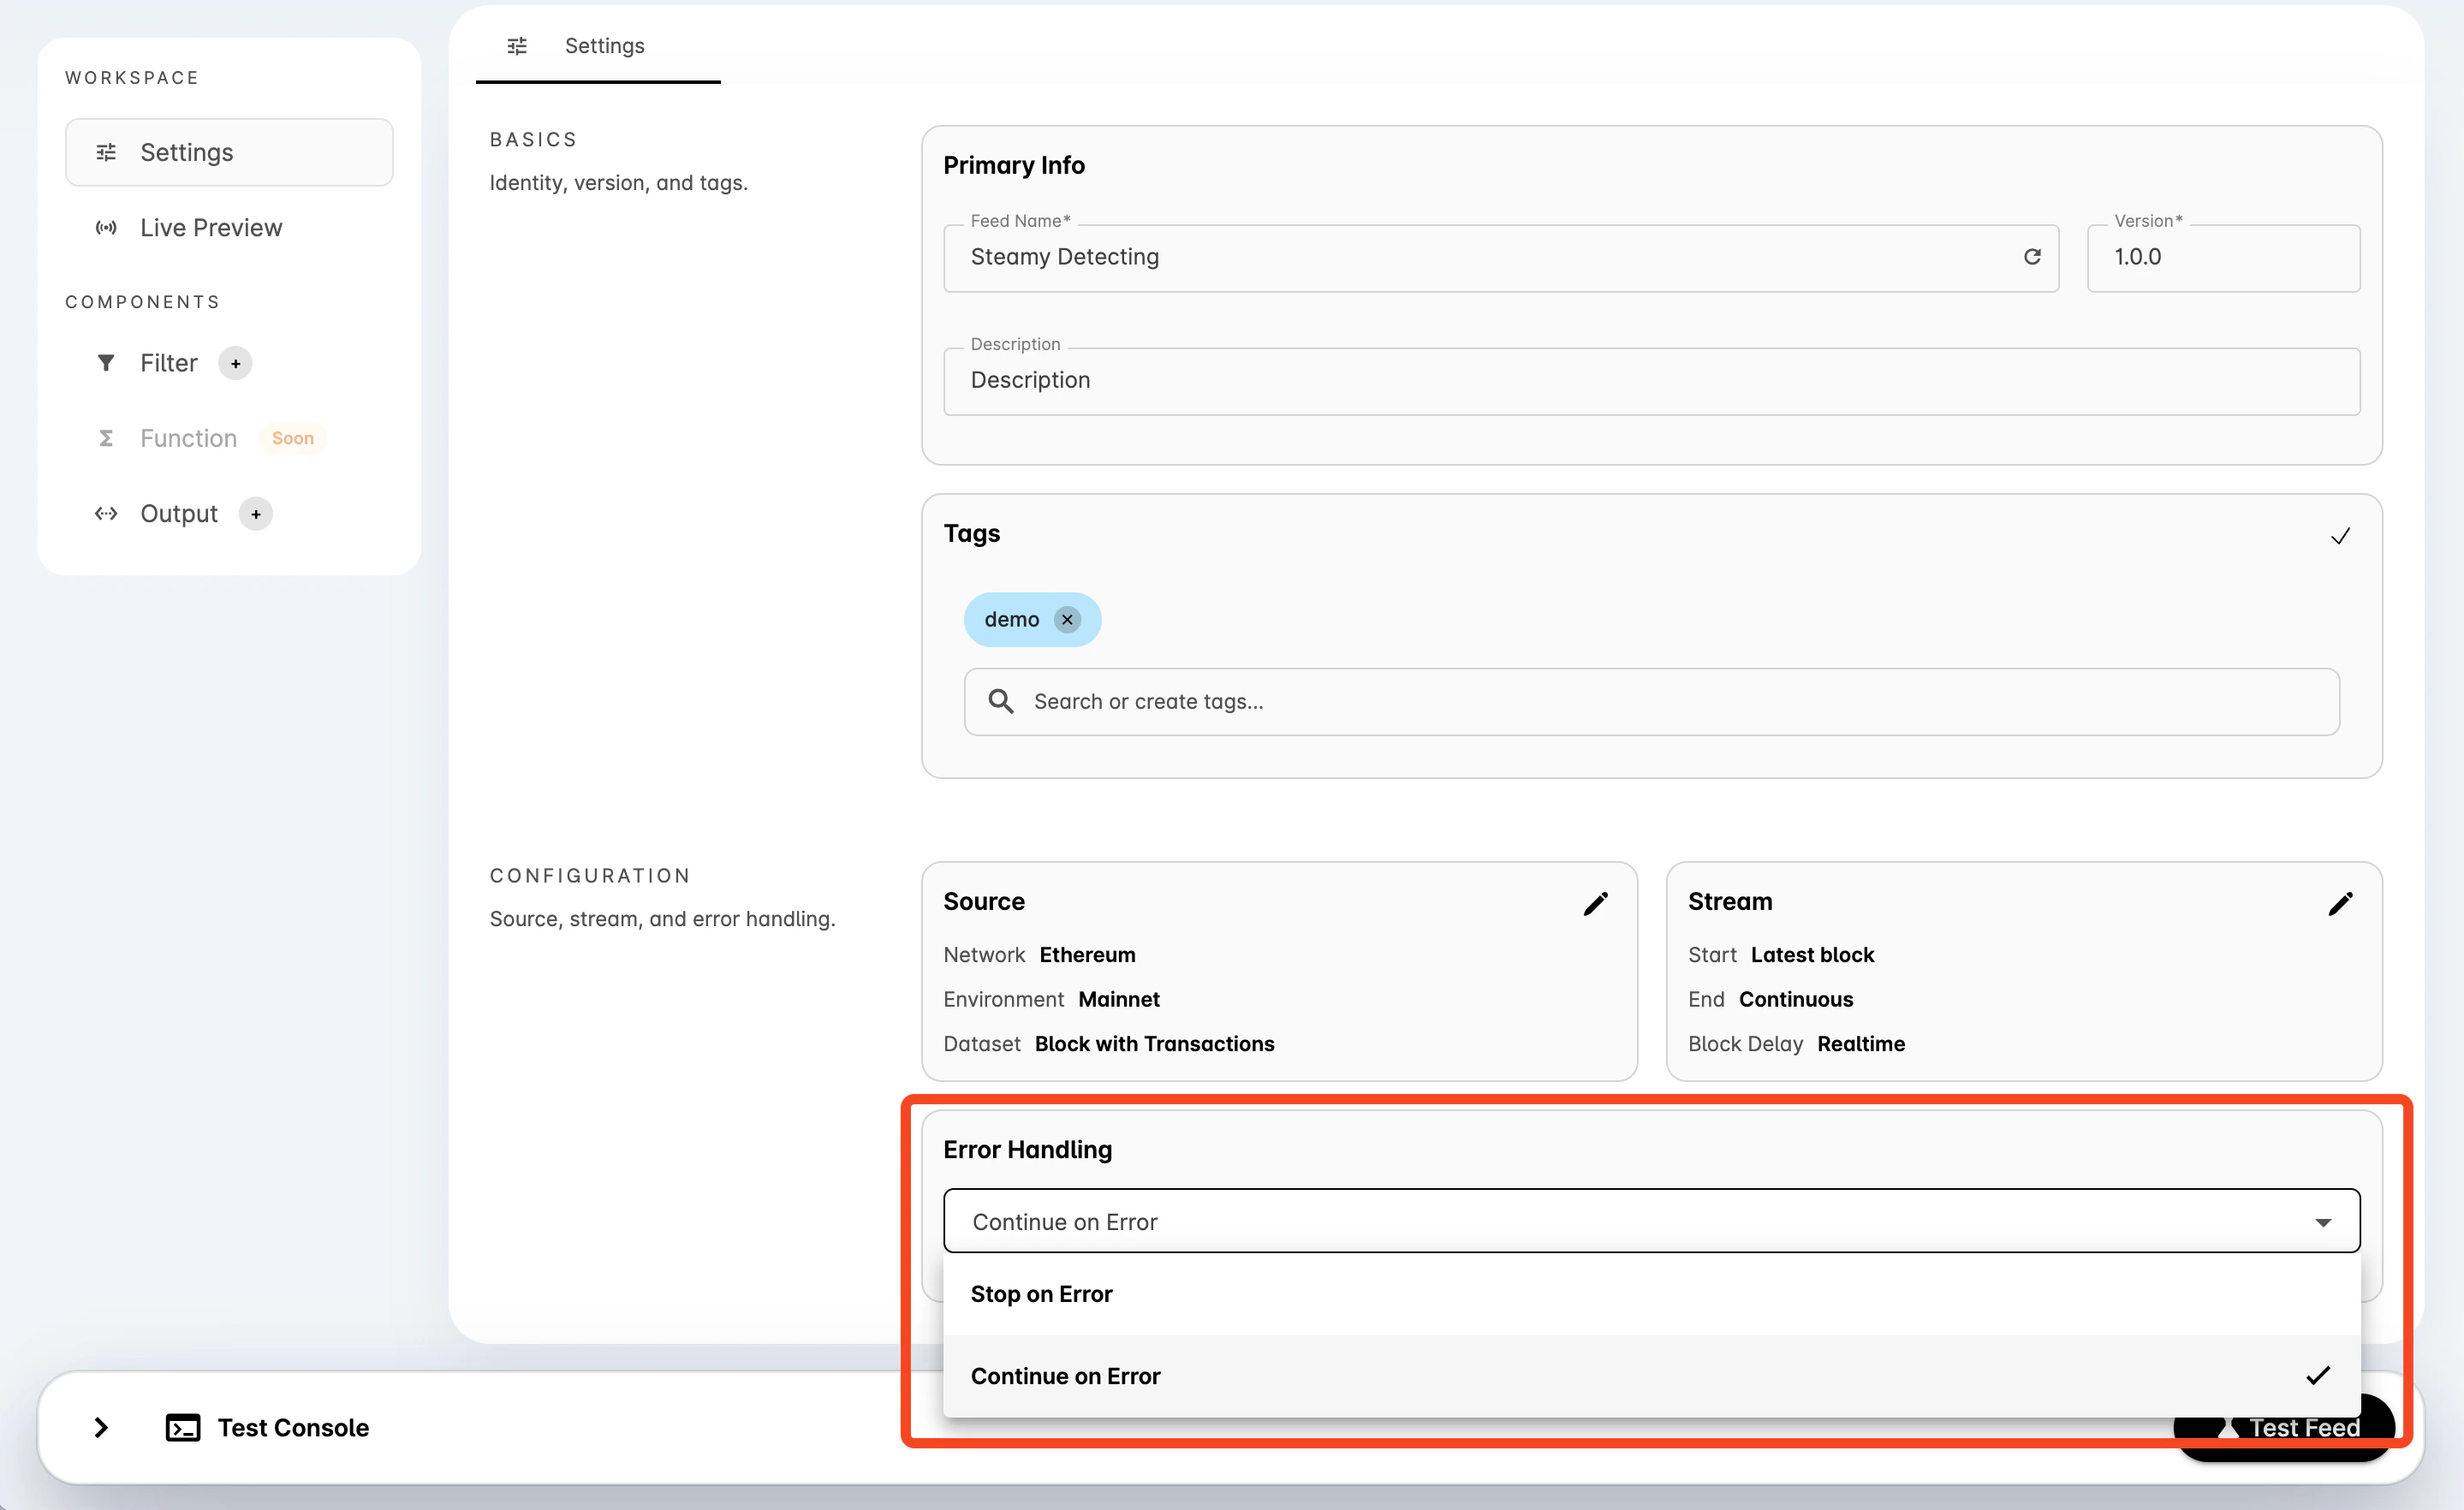
 ### Set Error Handling
In **Error Handling**, choose the strategy for runtime errors. The default flow is to continue on error when possible so one bad event does not stop the whole feed.
### Set Error Handling
In **Error Handling**, choose the strategy for runtime errors. The default flow is to continue on error when possible so one bad event does not stop the whole feed.
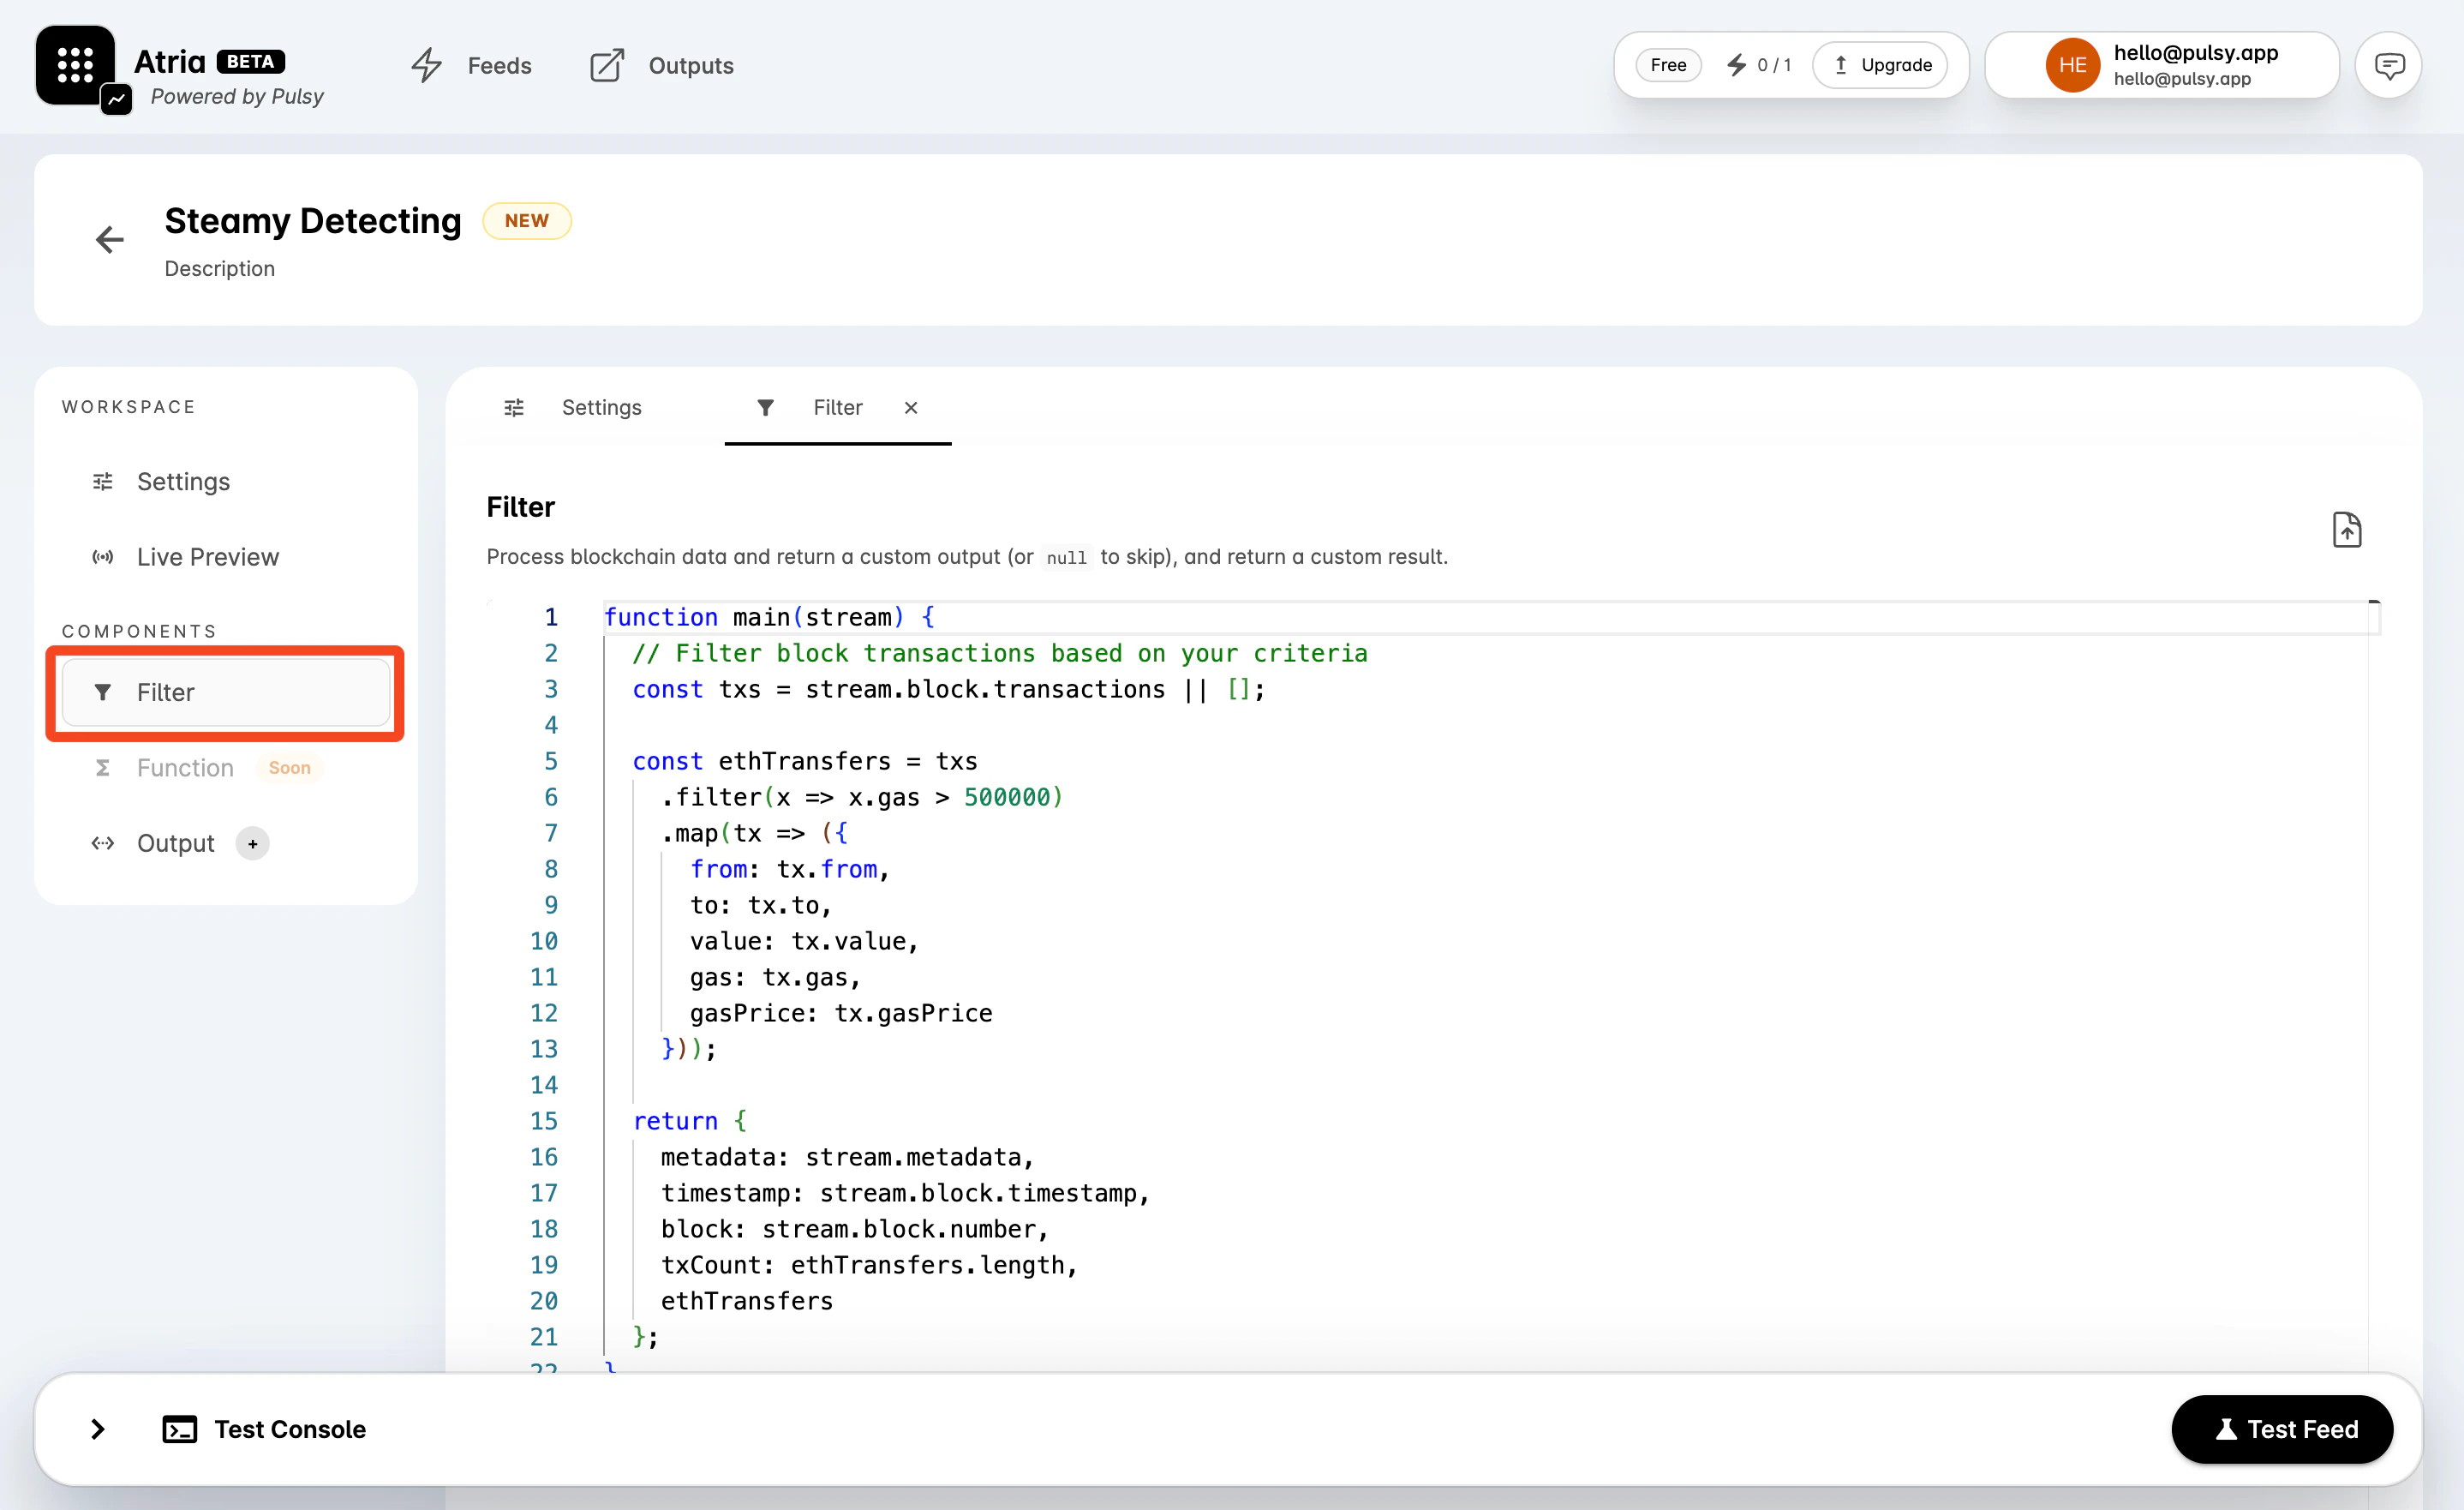
 ### Add Filter Logic
Select **Filter** in the workspace navigation. The dashboard opens a code editor and inserts a starter template based on the selected dataset.
The filter must define `main(stream)`. Return:
* A JSON-safe object when the feed should emit a result.
* `null` when the feed should skip the current block or event.
You can also upload a `.js` or `.ts` file from the upload button in the editor header.
### Add Filter Logic
Select **Filter** in the workspace navigation. The dashboard opens a code editor and inserts a starter template based on the selected dataset.
The filter must define `main(stream)`. Return:
* A JSON-safe object when the feed should emit a result.
* `null` when the feed should skip the current block or event.
You can also upload a `.js` or `.ts` file from the upload button in the editor header.
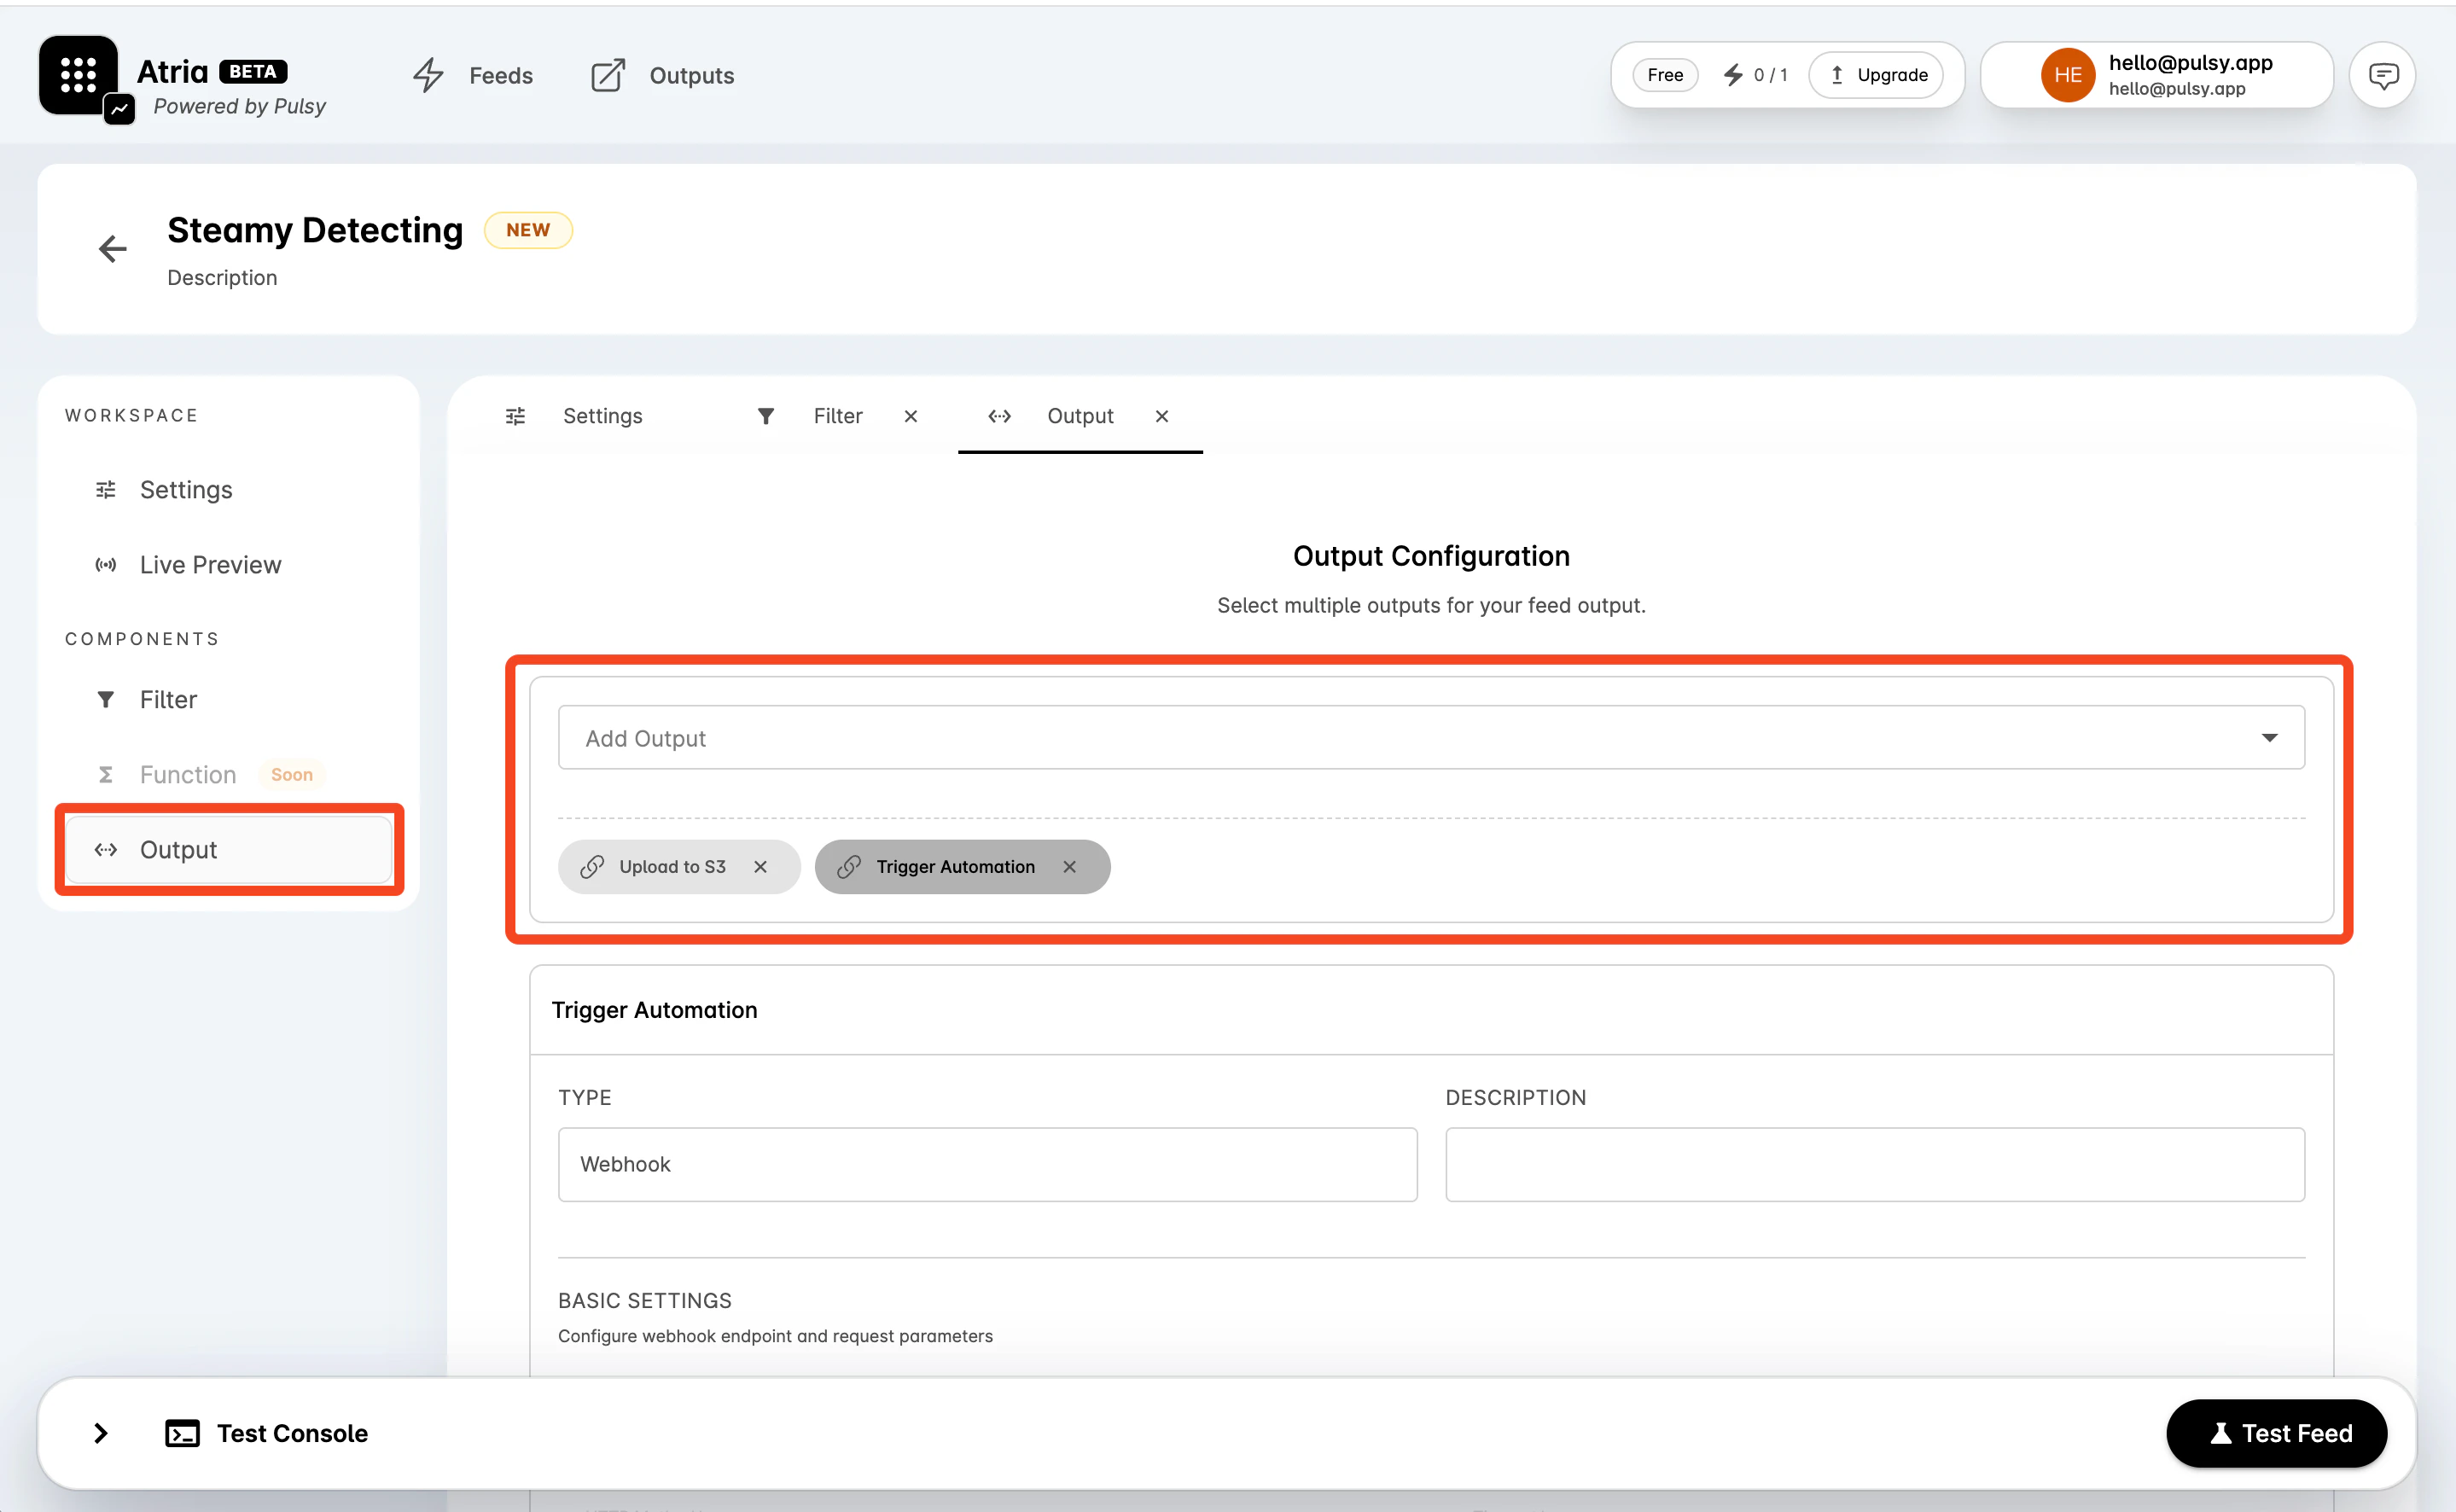
 ### Attach Outputs
Select **Output** in the workspace navigation.
1. Use **Add Output** to select one or more existing outputs.
2. Select an output badge to review its read-only configuration.
3. Remove an output with the close icon if it should not receive feed results.
If you only want to test logic first, you can leave outputs empty and attach them later.
### Attach Outputs
Select **Output** in the workspace navigation.
1. Use **Add Output** to select one or more existing outputs.
2. Select an output badge to review its read-only configuration.
3. Remove an output with the close icon if it should not receive feed results.
If you only want to test logic first, you can leave outputs empty and attach them later.
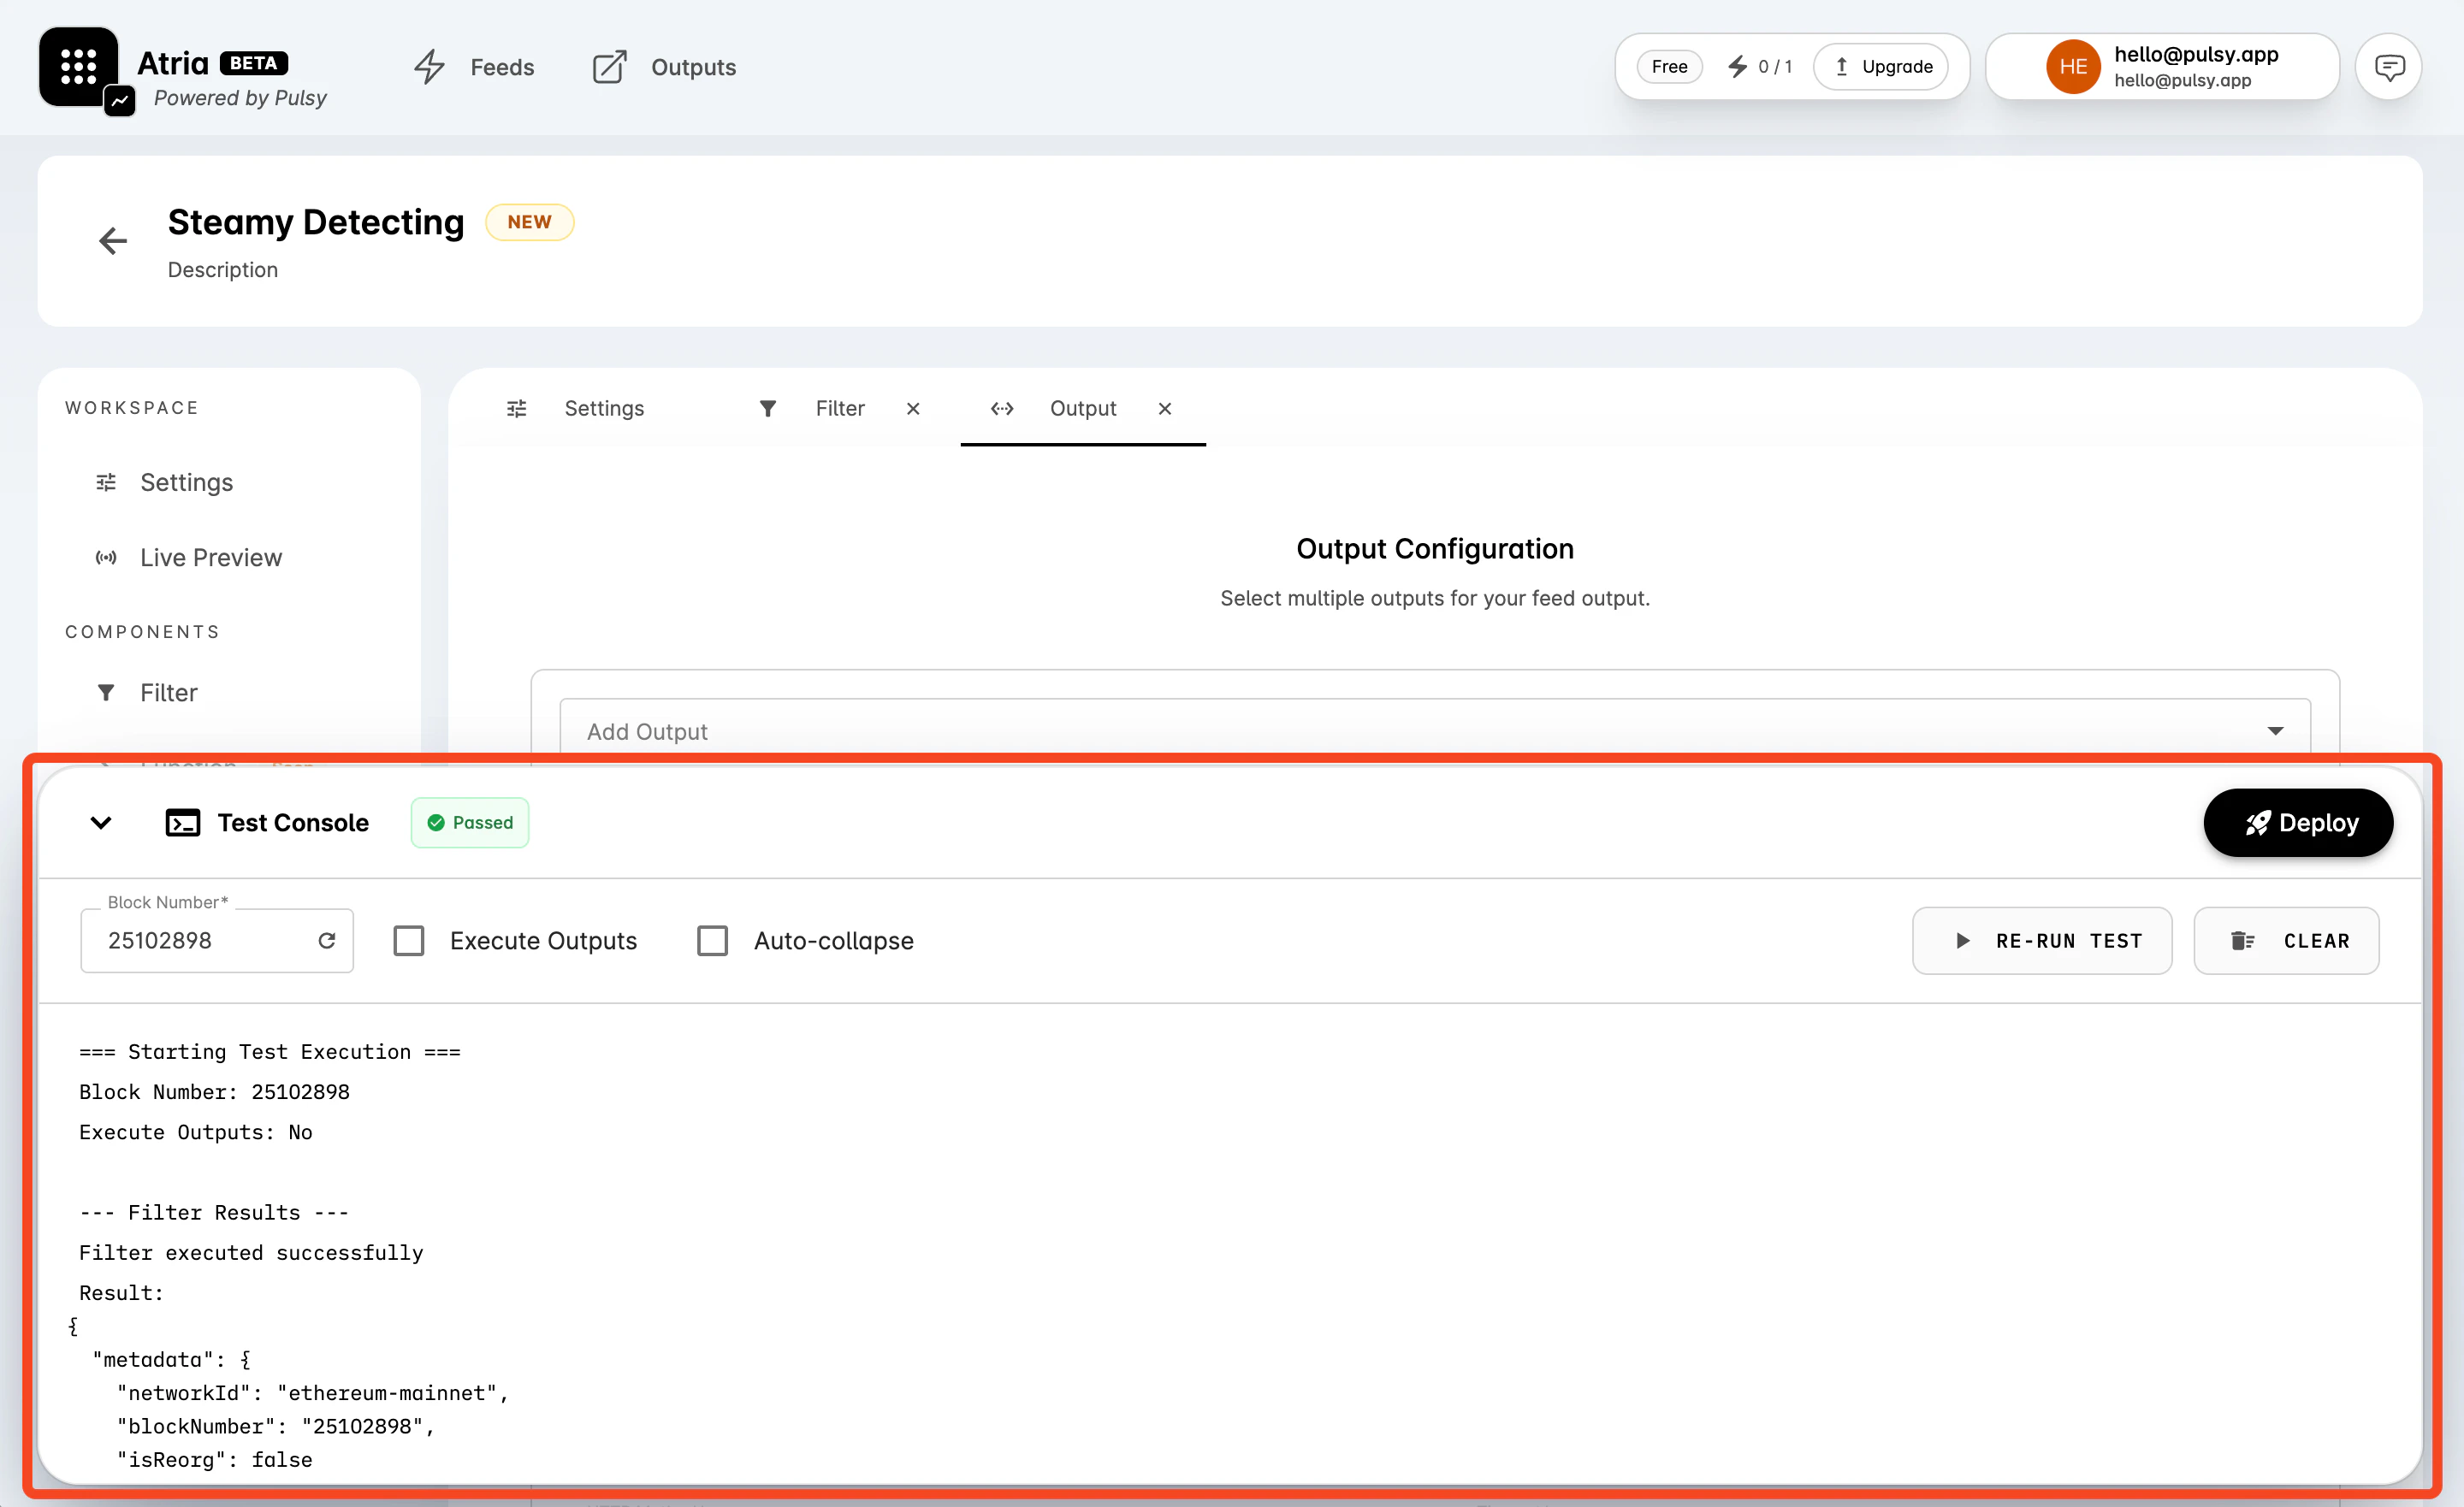
 ### Test the Feed
Open **Test Console** at the bottom of the workspace.
1. Enter a **Block Number**, or use the refresh icon to load the latest block for the selected environment.
2. Enable **Execute Outputs** only when you want the test run to call attached outputs.
3. Select **Test Feed**.
4. Review the console output.
If the filter and optional function return no errors, the console shows **Passed** and the primary action changes from **Test Feed** to **Deploy**.
### Test the Feed
Open **Test Console** at the bottom of the workspace.
1. Enter a **Block Number**, or use the refresh icon to load the latest block for the selected environment.
2. Enable **Execute Outputs** only when you want the test run to call attached outputs.
3. Select **Test Feed**.
4. Review the console output.
If the filter and optional function return no errors, the console shows **Passed** and the primary action changes from **Test Feed** to **Deploy**.
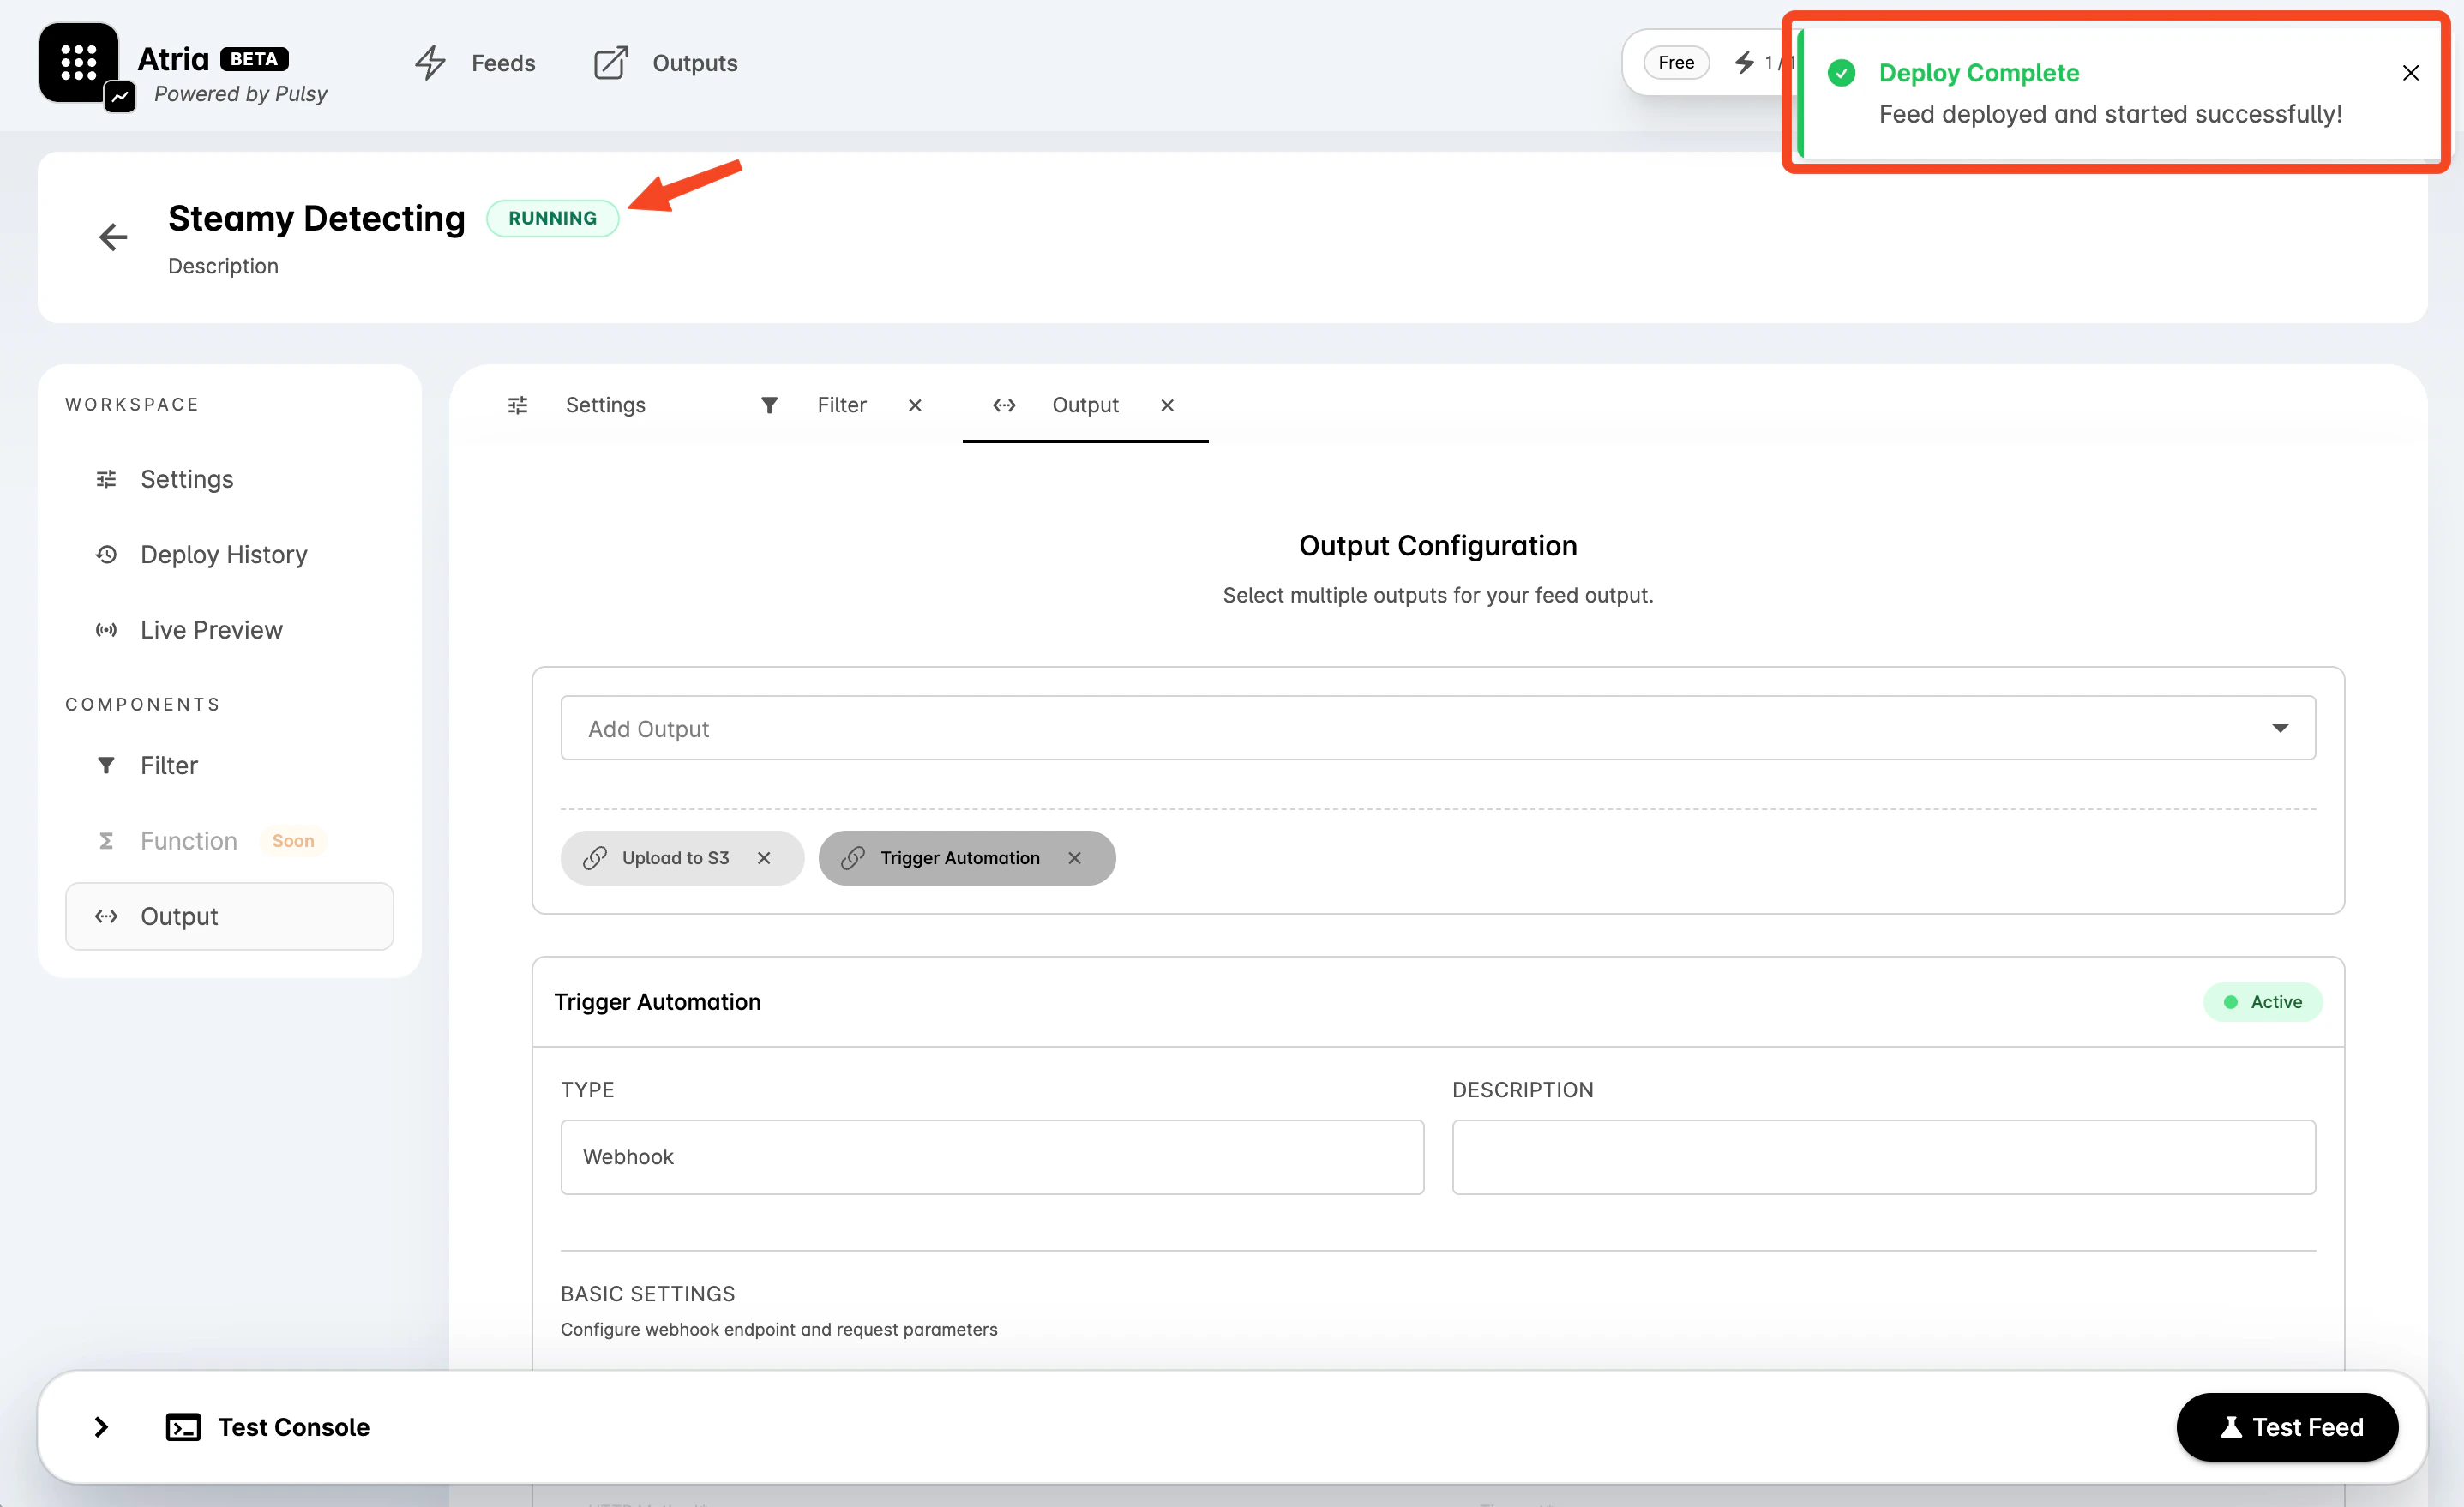
 ### Deploy and Start
Select **Deploy**.
For a new feed, the dashboard creates the feed and then starts it. For an existing feed, the dashboard updates the feed and then starts it.
### Deploy and Start
Select **Deploy**.
For a new feed, the dashboard creates the feed and then starts it. For an existing feed, the dashboard updates the feed and then starts it.
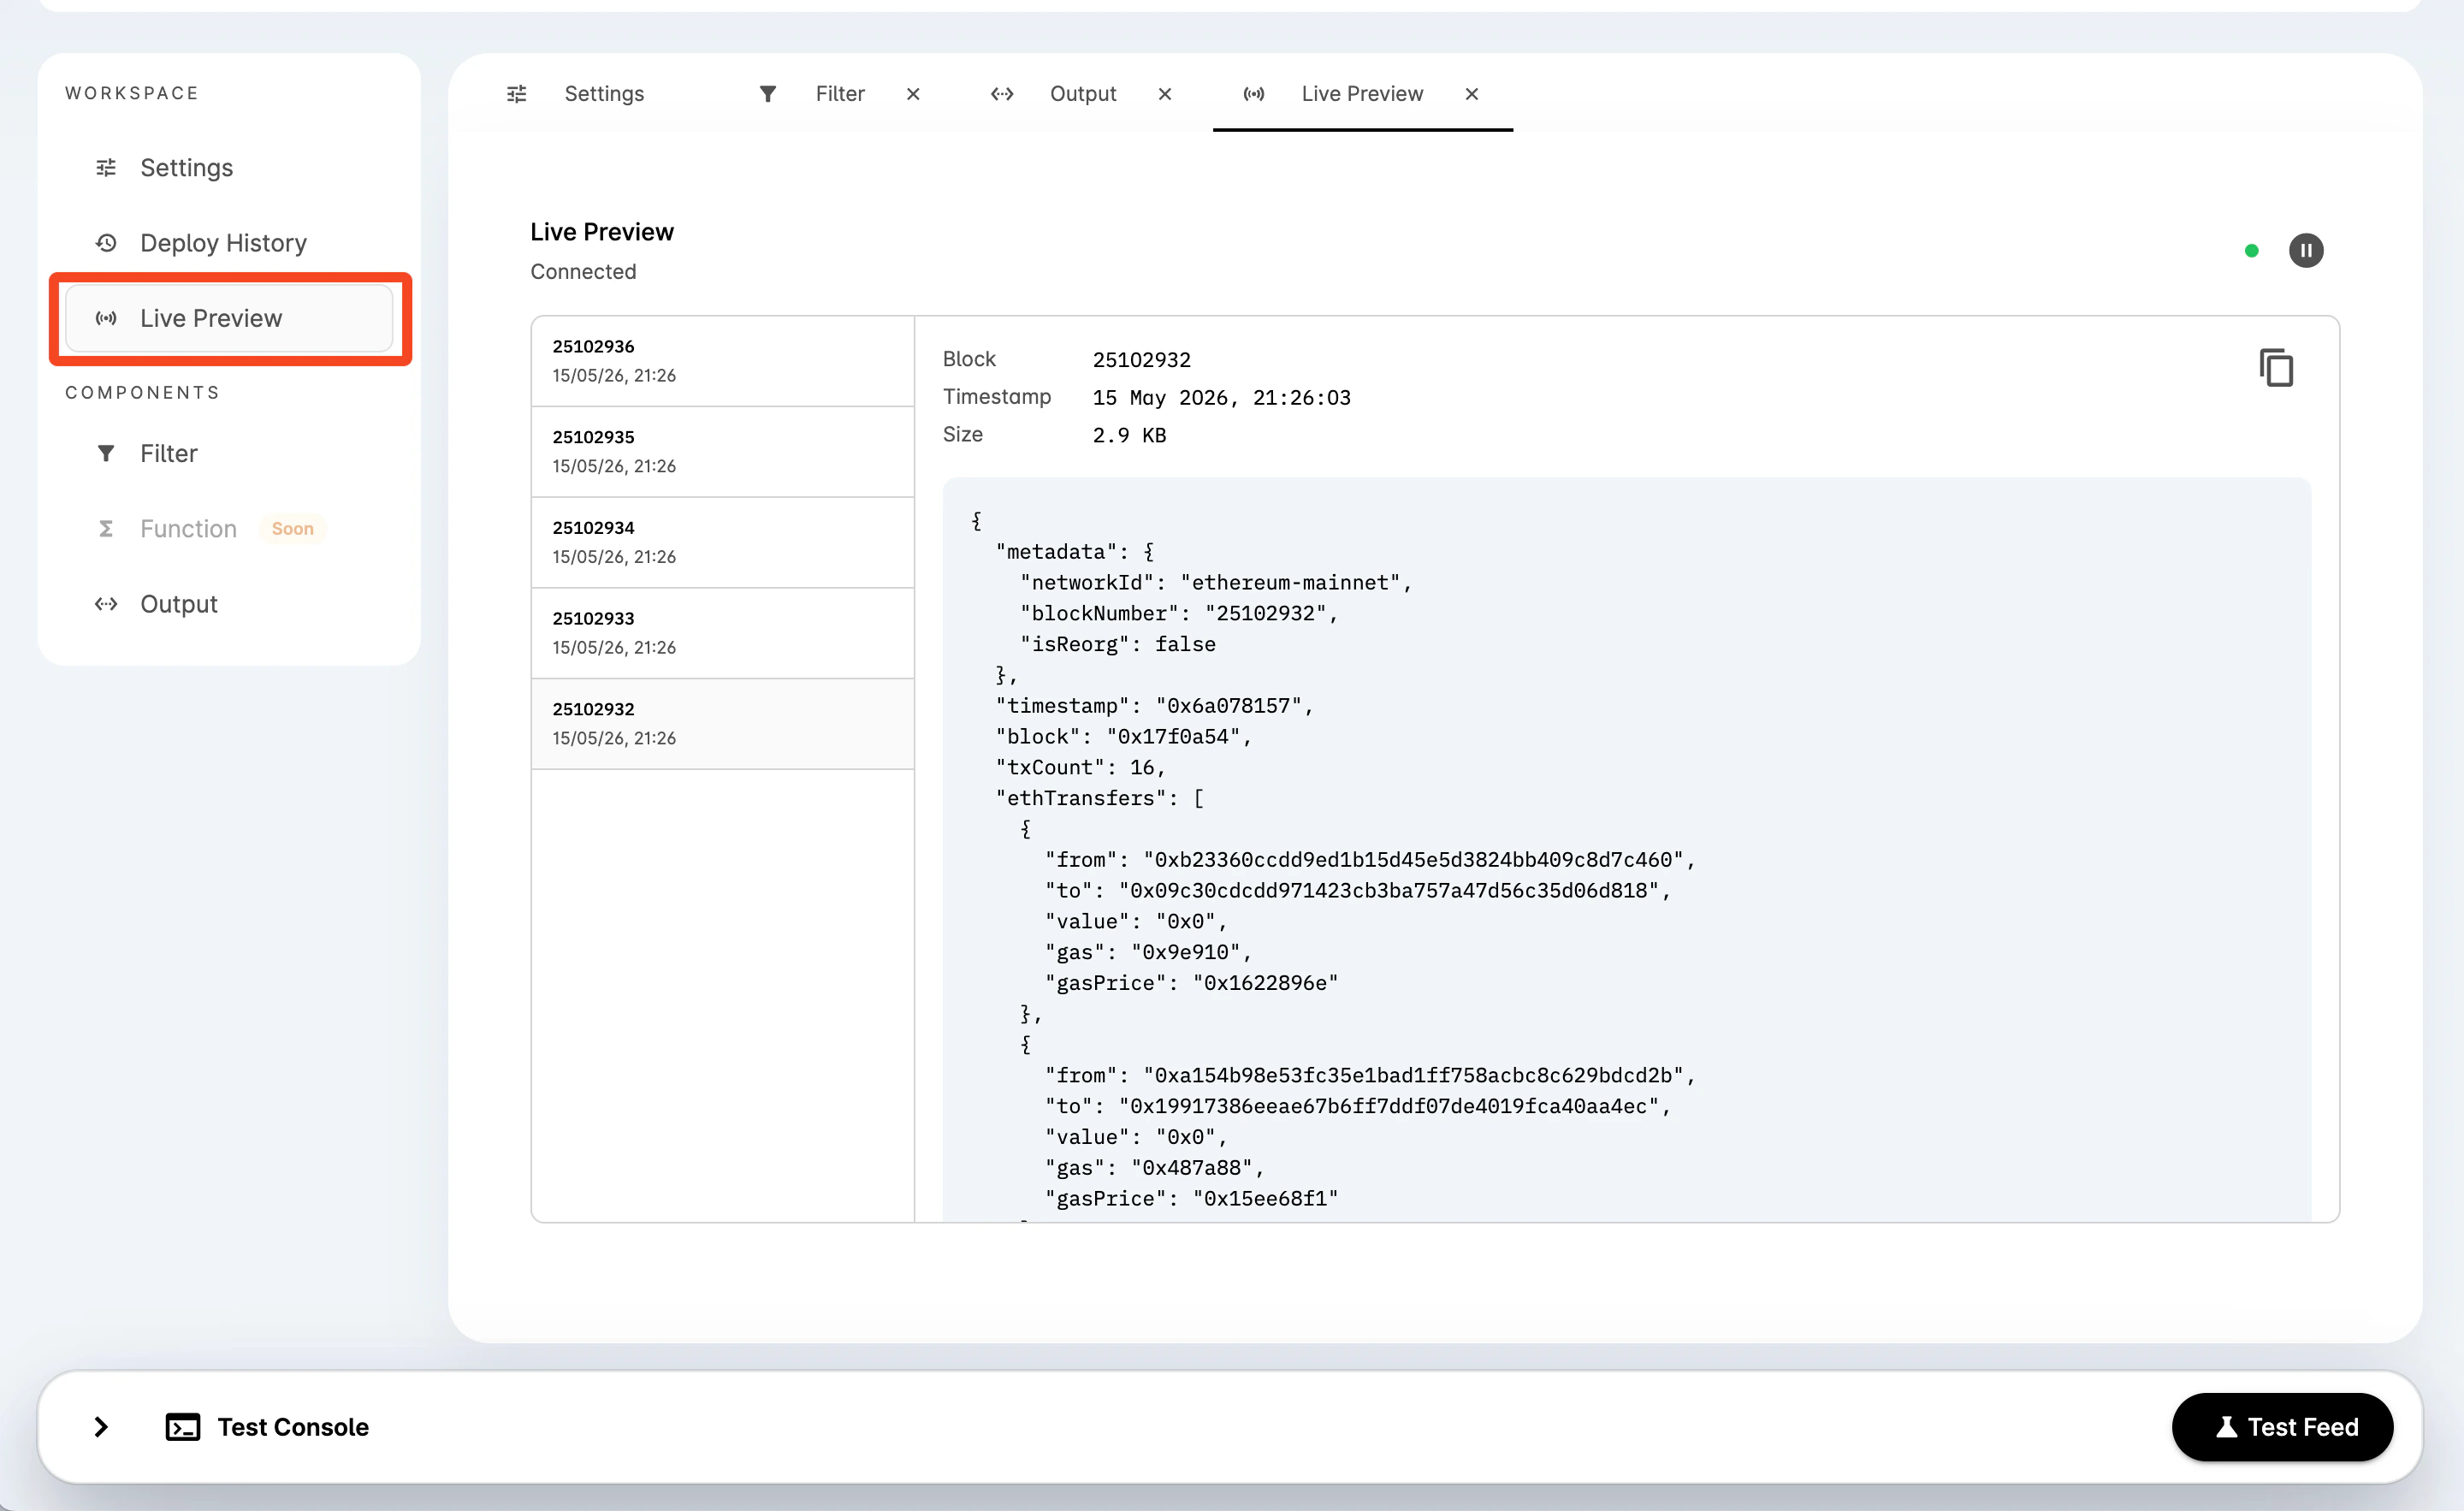
 ### Review Live Results
For an existing deployed feed, open **Live Preview** to watch real-time results. Results appear with block number, timestamp, size, and JSON data.
### Review Live Results
For an existing deployed feed, open **Live Preview** to watch real-time results. Results appear with block number, timestamp, size, and JSON data.
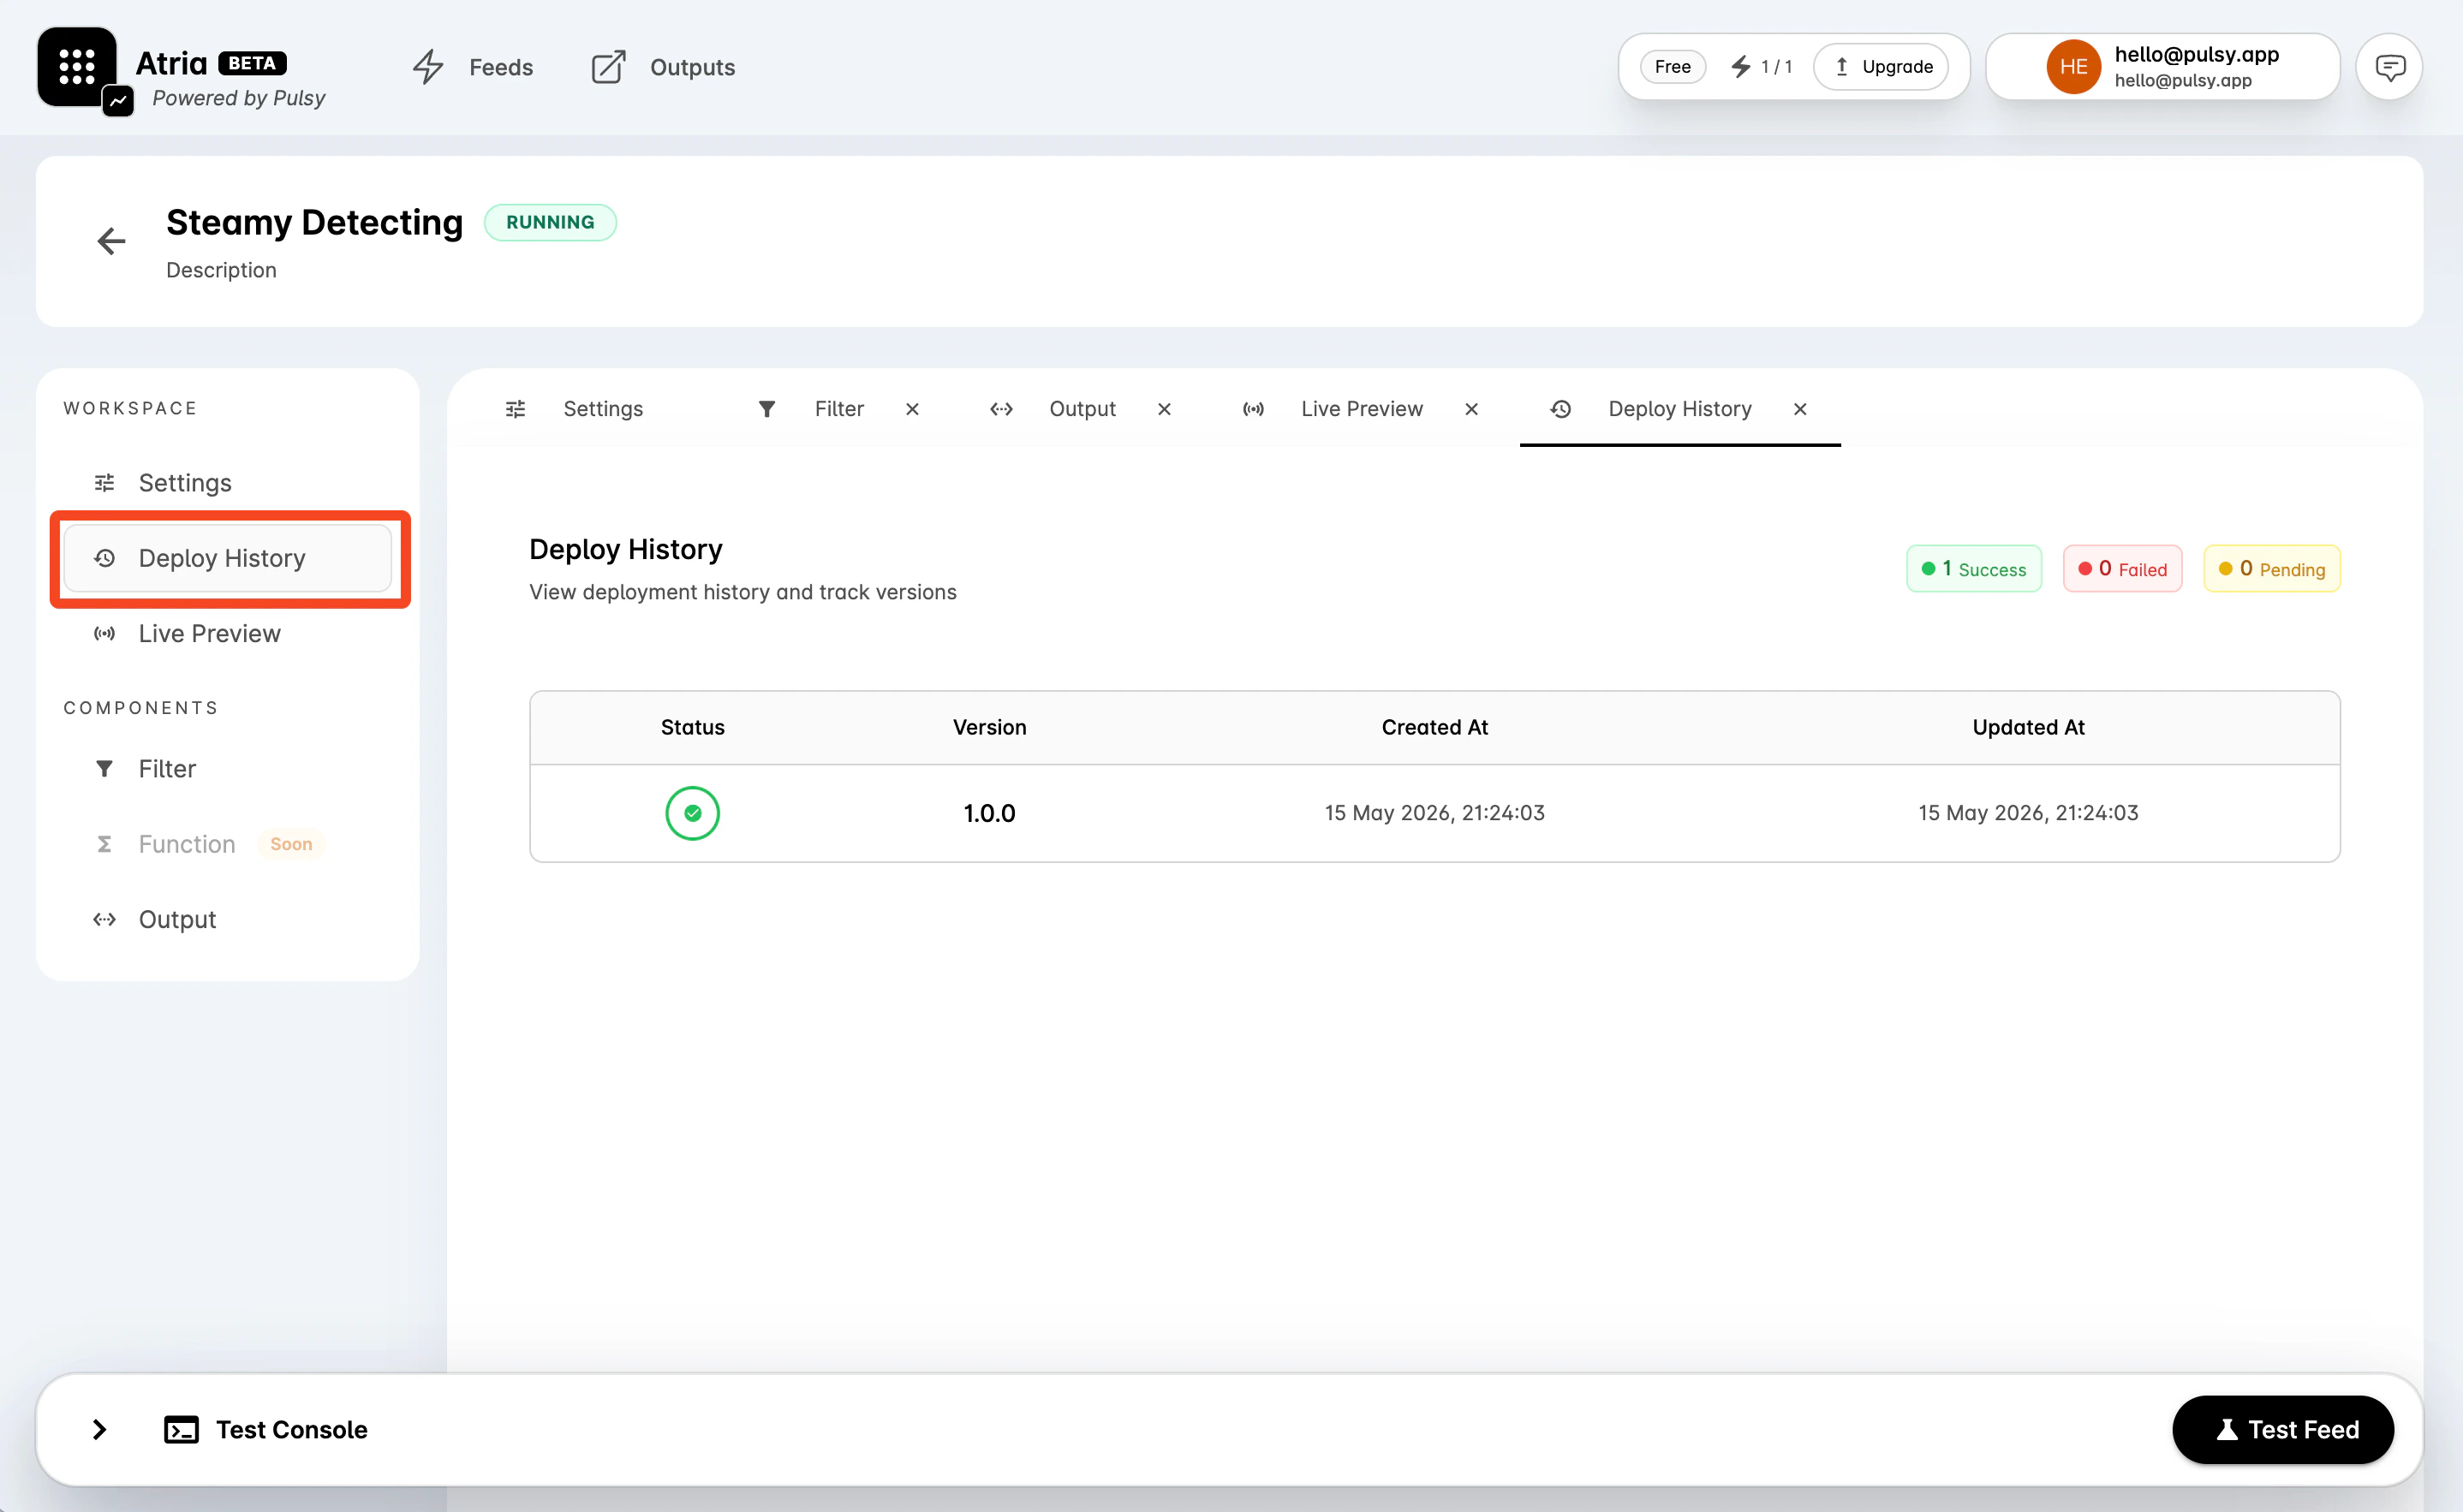
 ### Review Deploy History
For an existing feed, open **Deploy History** to review deployment status, version, creation time, and update time.
### Review Deploy History
For an existing feed, open **Deploy History** to review deployment status, version, creation time, and update time.